Figures & data
Figure 1. Schematic representation of preparation of EPR nanoemulsion (A) and EPR nanoemulgel (B).
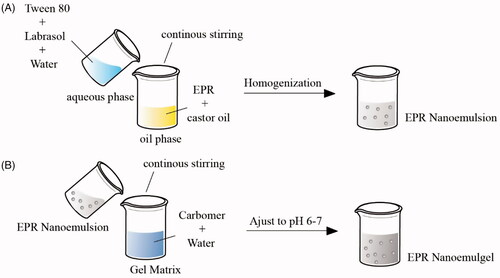
Figure 2. Device for the determination of bioadhension.
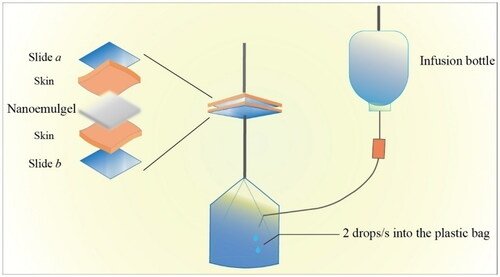
Figure 3. The effect of different compositions on viscosity and Ke of EPR formulations. A, C, E and G represented the effects of content of castor oil, Tween 80, Labrasol®, and carbomer on the viscosity of EPR nanoemulgel, respectively; B, D, and F represented the Ke of EPR nanoemulsion containing different amount of castor oil, Tween 80, and Labrasol®, respectively. (**: p < .01).
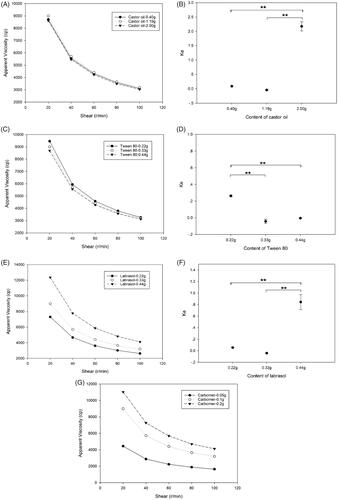
Figure 4. The appearance of 1% carbomer hydrogel (A), blank nanoemulgel (B), EPR nanoemulgel (C), and their SEM images (D).
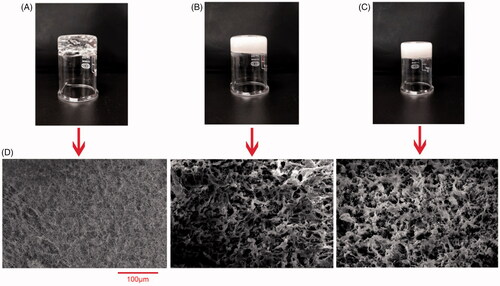
Table 1. The bioadhesion of different EPR nanoemulgels (g/cm2, mean ± SD).
Table 2. Transdermal penetration parameters of different EPR formulations (n = 3, mean ± SD).
Figure 5. H&E staining of intact skin (A) and damaged skin (B) applied with normal saline, intact skin and damaged skin applied with different formulations (C) for 72 h (200×). Arrows indicate the edema and lymphocytes.
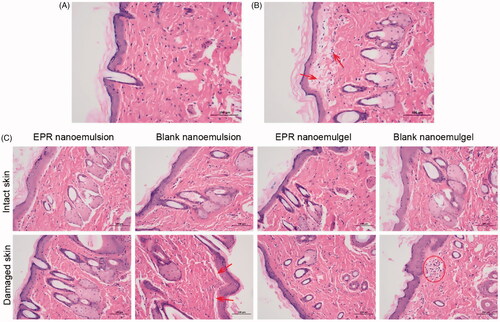
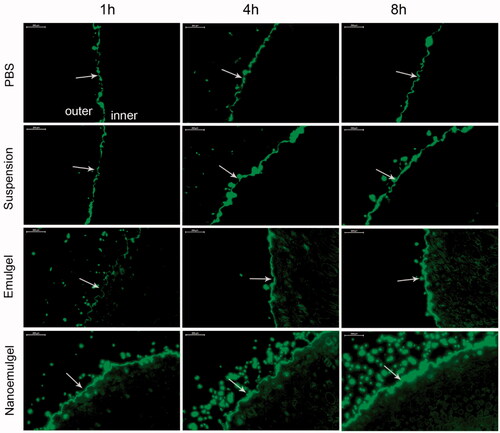
Figure 6. Fluorescence microscopy of mice skin applied with different FITC formulations. Arrows indicate the stratum corneum of the skin.