Figures & data
Figure 1. Geometry, methods and boundaries considered in this study. (A) A model representing the peritoneal cavity with a microscopic peritoneal nodule on the intestinal tract of the patient. (B) An enlarged version showing the three different types of tissue modeled in this study; healthy intestinal tissue, viable tumor tissue and a necrotic region at the center of the tumor. The tumor is embedded half way into the healthy tissue for all geometries. The size of the tumor varied from 1 to 4 mm. (C) The model during the simulation, where the yellow tumor embedded in the healthy white intestinal tissue is exposed to flow conditions relevant for HIPEC. The fluid, depicted by the waves, flows from the red side on the left to the blue side on the right. (D) The various boundary conditions encountered in the model which are explained in the boundary condition section.
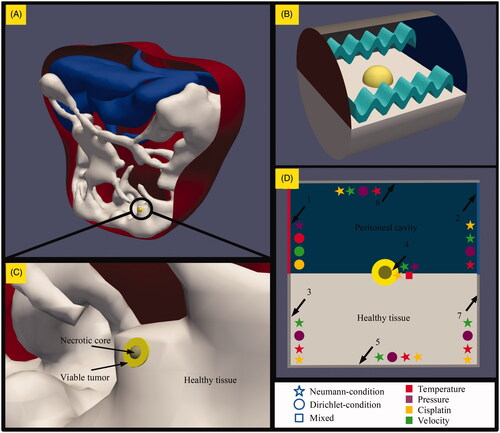
Figure 2. Schematic overview of the acquisition of data from the three-dimensional tumor models. The taupe colored necrotic tumor core is encapsulated by the yellow viable tumor tissue which is embedded in the healthy intestinal tissue while fluid flows over the tumors along the horizontal axis. Spherical models are probed along the vertical axes, seen on the left side while the spheroid models are probed along the vertical and horizontal axes, in this paper also referred to as minor and major axis, respectively. The coordinates represent normalized coordinates, normalized by the total length of the probe-line. These coordinates are also used in for an adequate comparison of the pressure and drug profiles for different tumor sizes.
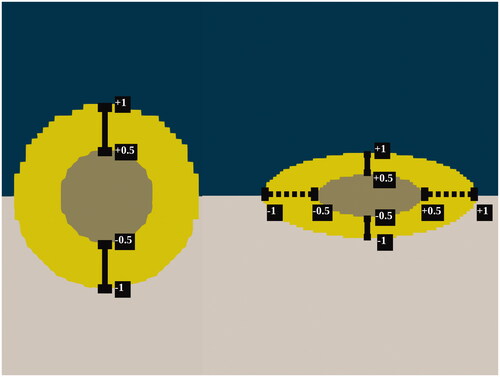
Table 1. Cisplatin diffusion properties.
Table 2. Parameters used for simulations.
Table 3 Definition of cases featured in this study. Cases are named after the parameter being tested, listed in the first column.
Table 4. IC50 values and thermal enhancement ratio (TER) of cisplatin for RKO cells, determined from clonogenic assays.
Figure 3. Mesh sensitivity analysis. Computational grids include hexahedral and polyhedral elements. Grids used for the tumor region consisted out of and
cells for the low, medium and highly refined meshes. The study focused on the relevant intratumoral parameters such as the interstitial pressure and velocity distribution. The distributions for interstitial fluid pressure (IFP) and velocity were similar for all three grid resolutions. Only the low refined mesh was unable to correctly simulate the velocity gradient near the edge of the tumor, illustrated by the vertical red line.
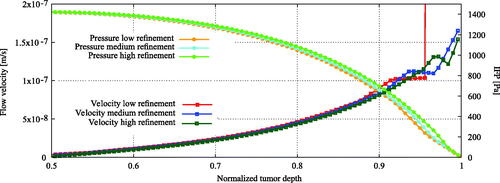
Figure 4. Experimental comparison for the interstitial fluid pressure (IFP) profile in the 4 millimeter tumor nodule considered in this study with experimental data from Boucher et al. (Citation1990). The interstitial pressure profile inside the necrotic region was linearly interpolated between boundaries of the necrotic and viable tumor tissue.
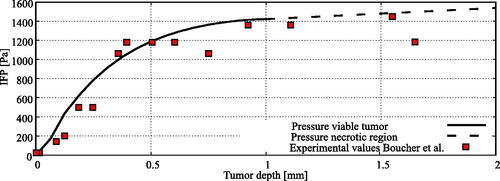
Figure 5. Baseline results showing (A), interstitial fluid pressure (IFP) profiles in Pa versus the normalized penetration depth and (B), cisplatin distributions in mM versus the normalized penetration depth. Spherical radii considered were 0.5, 1 and 2 millimeter. Spheroid tumor sizes considered were 0.25, 0.5 and 1 millimeter along the minor axis (MiA) with a fixed radius along the major axis (MaA) at 1.25 millimeter. The tumor depth on the horizontal axis was normalized using the total length of the probe line, depicted in . For spherical and spheroid tumors along the minor axis, the normalized tumor depth −1 can be interpreted as the edge between the viable tumor region and the normal tissue region and normalized tumor depth +1 can be interpreted as the boundary between viable tumor tissue and the peritoneal cavity. The major axis was oriented along the flow direction, orthogonal to the vertical axis.
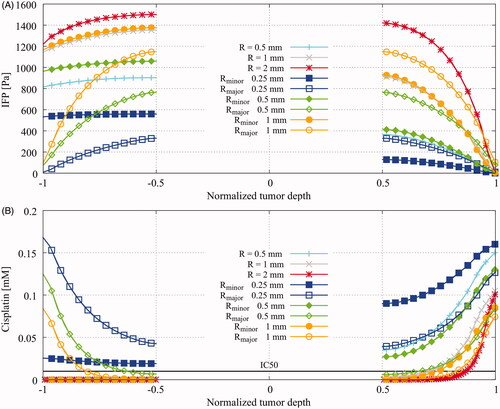
Table 5. Maximal achieved interstitial pressures and average accumulated drugs in the various baseline geometries.
Figure 6. Flow velocity influence on cisplatin and thermal distributions at the tumor surface. Lower flow velocities results in a lower amount of cisplatin on the surface while higher flow velocities lower the coverage around the tumor surface. The similar phenomenon is visible for the average temperature inside the tumor. This general behavior suggest that an intermediate velocity is optimal to heat the peritoneal surface fast while maintaining sufficient cisplatin coverage. The orange line depicts the thermally enhanced equivalent dose. Based on the enhanced equivalent dose we can determine the optimal velocity range, shown by the green area, where both temperature and cisplatin coverage are high. The optimal range was determined as the range where the maximal enhanced dose is achieved.
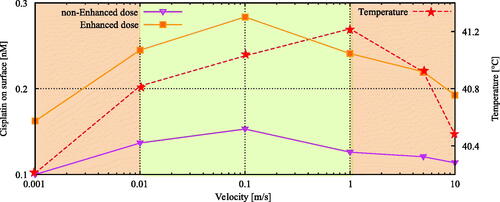
Figure 7. Cisplatin distributions showing the qualitative behavior of the influence of (A) temperature and (B) administered dose on the penetration depth of cisplatin. Coordinates run toward the tumor-peritoneal cavity boundary at +1. See for a detailed explanation of the coordinates. Using higher temperatures, a lower dose of cisplatin is needed to induce the same amount of cell death illustrated by a lower IC50 value, plotted as the dashed lines in (A). In combination with a higher diffusivity, this results in a larger penetration for higher temperatures. Higher doses result in a larger penetration depth, as is shown in (B).
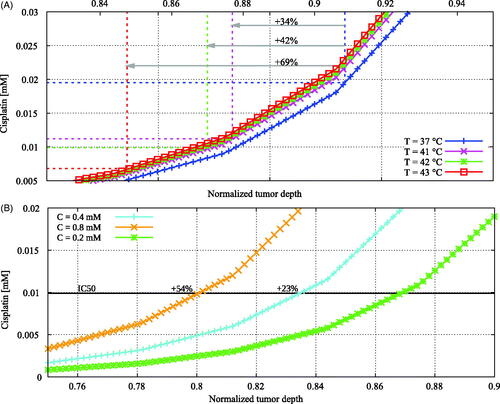
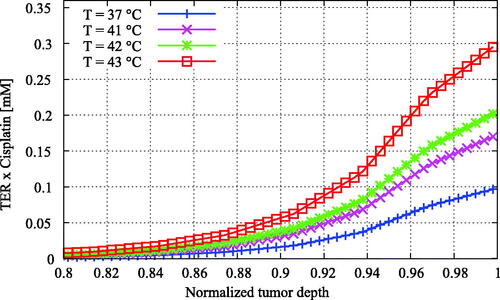
Figure 8. Enhanced cisplatin distributions versus the normalized tumor depth for varying temperature. The enhanced cisplatin dose was calculated by multiplying the cisplatin concentration by the thermal enhancement ratio of the temperature level (). The enhancement of the treatment effectiveness due to elevated temperatures is now more apparent than in , showing higher effective doses for higher temperatures.