
Figures & data
Table 1. Independent variables and their levels, along with dependent variables and their constraints in the Box–Behnken designs of plain and medicated nanoemulsion formulations.
Table 2. Box–Behnken design responses of plain NE formulation.
Table 3. Box–Behnken design responses of NF-CO-SENDDs.
Figure 1. (A) Contour plot, (B) 3D surface plot, and (C) overlay plot showing the effects of different independent variables on the globule size of plain nanoemulsion.
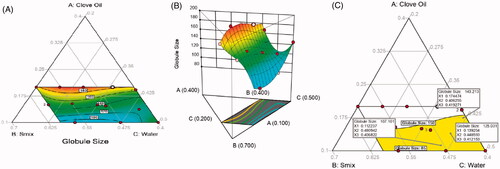
Figure 2. Main effect diagram, contour, and 3D response surface plots representing the effect of the studied variables on droplet size (Y1). (A) Main effect diagram of clove oil (%); (B) main effect diagram of naftifine amount (mg); (C) main effect diagram of Smix ratio (%); (D) contour plot showing the effect of clove oil and naftifine on globule size; (E) 3D surface plot representing the effects of the clove oil % and naftifine amount (mg) on droplet size.
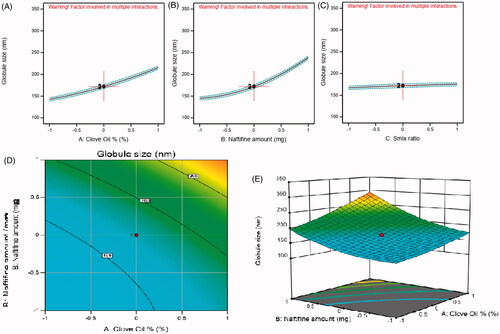
Figure 3. Main effect diagram, contour, and 3D response surface plots representing the effect of the studied variables on ex vivo % naftifine permeated (Y2). (A) Main effect diagram of clove oil (%); (B) main effect diagram of naftifine amount (mg); (C) main effect diagram of Smix ratio (%); (D) Contour Plot showing the effect of clove oil and naftifine on ex vivo % naftifine permeated; (E) 3D Surface plot representing the e effects of the clove oil % and naftifine amount (mg) on ex vivo % naftifine permeated.
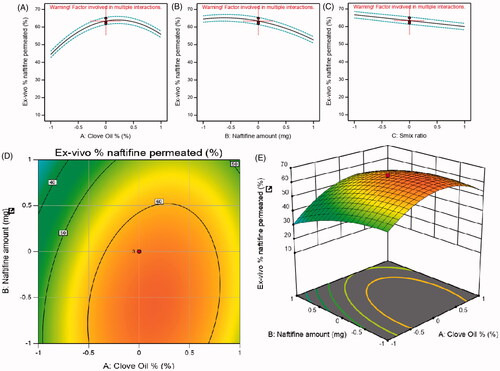
Figure 4. Main effect diagram, contour, and 3D response surface plots representing the effect of the studied variables on the zone of inhibition against Trichophyton rubrum (Y3). (A) Main effect diagram of clove oil (%); (B) main effect diagram of naftifine amount (mg); (C) main effect diagram of Smix ratio (%); (D) contour plot showing the effect of clove oil and naftifine on zone of inhibition against Trichophyton rubrum; (E) 3D surface plot representing the effects of the clove oil % and naftifine amount (mg) on zone of inhibition against Trichophyton rubrum.
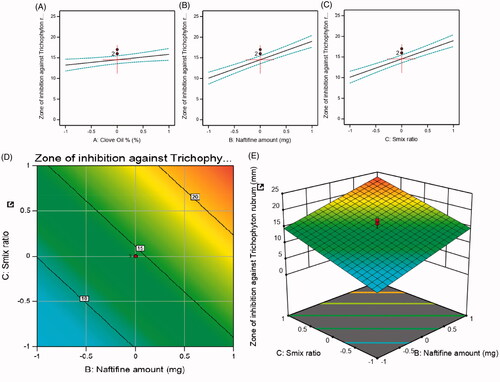
Figure 5. Main effect diagram, contour, and 3D response surface plots representing the effect of the studied variables on IL-31 level (Y4). (A) Main effect diagram of clove oil (%); (B) main effect diagram of naftifine amount (mg); (C) main effect diagram of Smix ratio (%); (D) contour plot showing the effect of clove oil and naftifine on IL-31 levels; (E) 3D surface plot representing the effects of the clove oil % and naftifine amount (mg) on IL-31 levels.
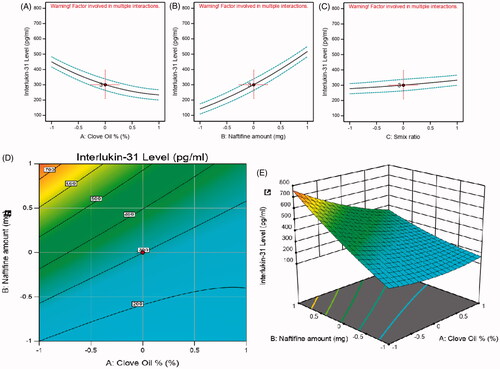
Table 4. Regression analysis results for Y1, Y2, Y3, and Y4 responses.
Figure 6. Desirability ramp and bar chart for optimization. (A) Desirability ramp shows the levels for independent variables and predicted values for the responses of the optimum formulation. (B) Bar chart shows the desirability values for the combined responses.
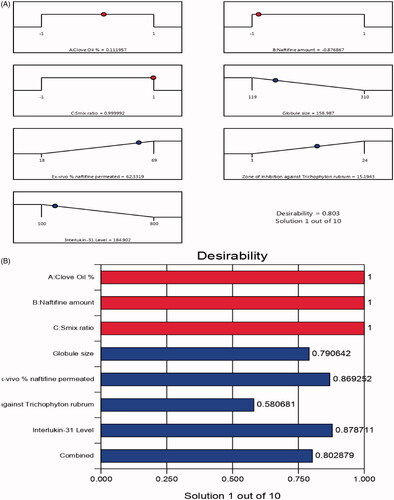
Table 5. Actual and experimental values of the optimized nanoemulsion formulation.
Figure 7. Overlay plot for the optimal NF-CO SNEDDS region determination.
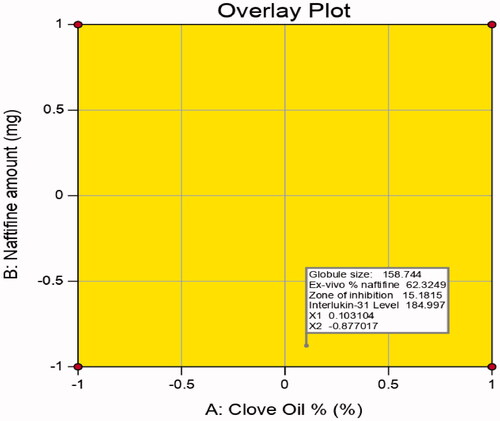
Table 6. Composition, actual, and predicted responses of the optimal nanoemulsion formulation.
Table 7. Permeation parameters of optimum NF-CO-SENDDs.
Table 8. Scoring of skin sensitivity test results of optimum NF-CO-SENDDs.
Table 9. Physical stability parameters of stored and freshly prepared NF-CO-SENDDs.