Figures & data
Figure 1. Synthesis of PB-PEG-DSPE. PB-PEG-DSPE was synthesized by conjugating PB with the amido groups of DSPE-PEG through amide formation.
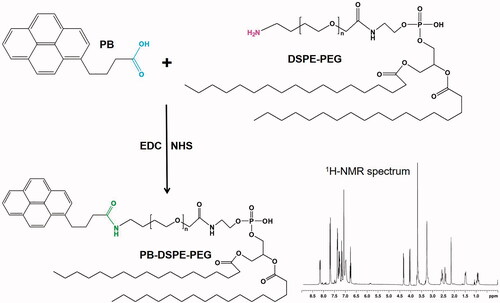
Figure 2. Scheme graph and transmission electron microscope image of TAT/PB LID NLC. TAT/PB LID NLC was prepared by solvent diffusion method. The morphology and size of TAT/PB LID NLC was visualized by a transmission electron microscope.
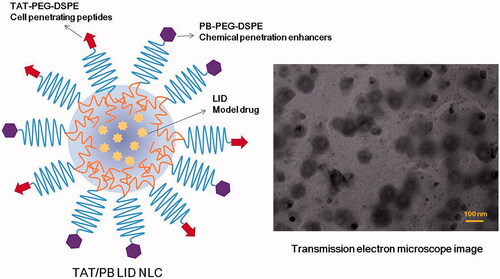
Figure 3. Storage stability of NLC. The NLC showed no significant change on size (A), PDI (B), EE (C), and DL (D) during the storage at 2–8 °C for a period of 90 days. Data presented as mean ± standard derivation (n = 6).
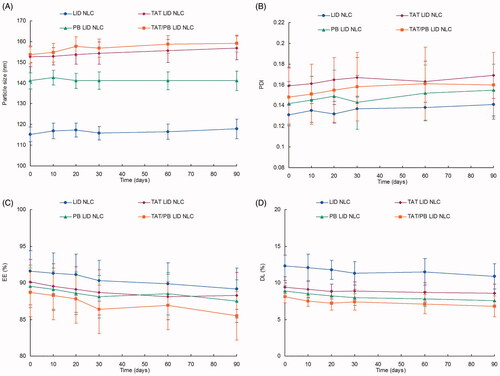
Table 1. Characterization of NLC.
Figure 4. In vitro drug release profiles of NLC. Dialysis method was applied to evaluate the in vitro drug release of LID from the NLC. Data presented as mean ± standard derivation (n = 6).
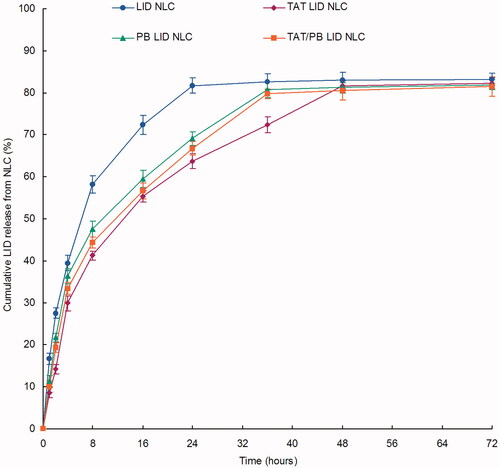
Figure 5. In vitro percutaneous penetration effect of NLC. In vitro skin permeation study was carried out in Vertical Franz-type diffusion cells with cross-sectional area of 5.93 cm2 and 7.0 mL cell volume. Data presented as mean ± standard derivation (n = 6). *p < .05.
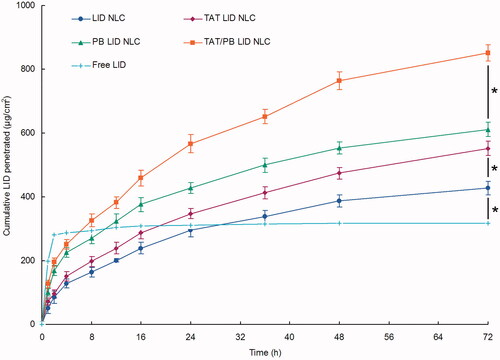
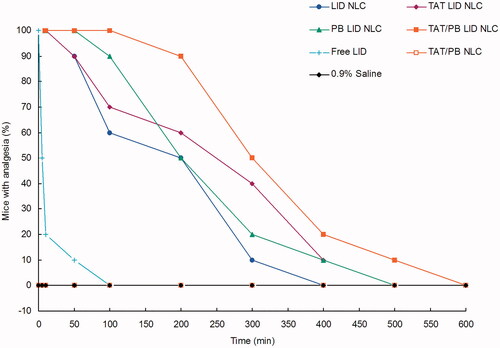
Figure 6. In vivo anesthetic pain relief effect was assessed by the tail-flick test in rats. A harmful heat stimulus was applied to the back surface of the tail by a focused radiant heat source. Percentage of the maximum possible effect (MPE) was applied to express the anesthetic pain relief effect. Data presented as mean ± standard derivation (n = 8).
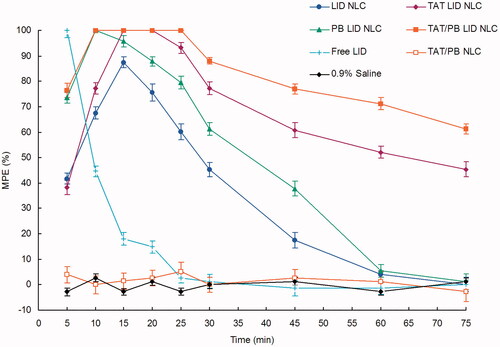
Figure 7. In vivo analgesia duration test was applied by electrical stimulation testing in mice. A current generator was used to measure the analgesic effect by the vocal response to electrical stimulation (starting at 1 mA and increasing to a maximum of 8 mA) directly over the skin of the abdomen at the injection site.