Figures & data
Table 1. Formulation table.
Figure 1. Severe hepatic necrosis in the left lobe of liver was induced by IPN hydrogel injection in early phase. (A) The hepatic histology was detected by H&E staining. Circled areas indicate hepatic necrosis. Bar = 400 μm. (B) The portal vein anatomy was scanned by MRI before and after (at 2, 18, and 24 hours) IPN hydrogel treatment. The upper panel was T2 weighted MRI images and the lower panel was T1 weighted MRI images. (C) The RFP-labeled hydrogels and GFP-labeled tumor cells in the tumor area at 2 weeks after IPN hydrogel treatment were detected by fluorescence microscope. Bar = 200 μm.
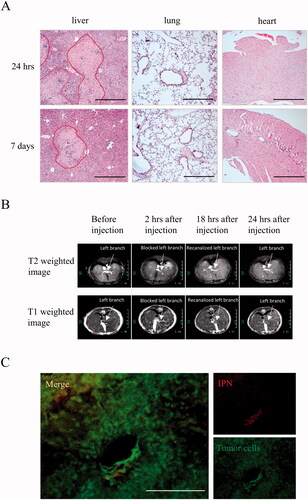
Figure 2. IPN hydrogel based TPVE decreased tumor development (A) IVIS spectrum was introduced to monitor the development of tumor every week after tumor implantation for 4 weeks. The bar chart showed the average radiance signaling (luciferase) of the tumors. (B) Tumor volume was examined and compared from each group. (C) Plasma AFP levels were compared from each group (N = 5/group; ∗p < .05 differences between treatment group and negative control group; #p < .05 differences between treatment groups).
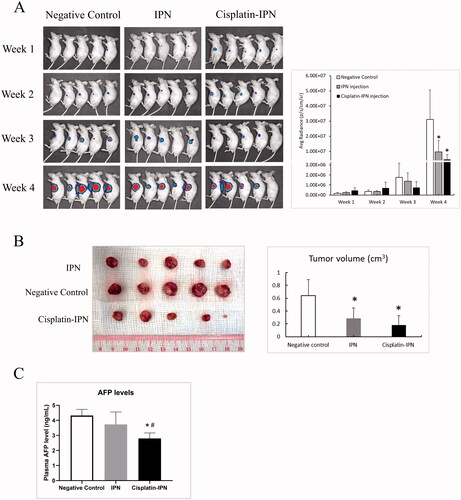
Figure 3. IPN hydrogel based TPVE suppressed tumor proliferation. (A) The tumor histology was detected by H&E staining. Bar = 400 μm. The necrosis area percentages in tumors were compared from each group as shown in the bar chart. (B) The proliferation levels were detected by anti-Ki67 staining. Bar = 200 μm. The Ki67 positive cells per field in the tumors were compared from each group as shown in the bar chart. (C) The apoptosis levels were detected by TUNEL assay. Bar = 200 μm. The TUNEL-positive cells per field in tumors were compared from each group as shown in the bar chart. (D) The expressions of intra-tumor caspase 3, cleaved caspase 3, Akt, phosphorylated Akt, ERK1/2, and phosphorylated ERK1/2 from each group were detected by Western Blot. (∗p < .05 differences between treatment group and negative control group; #p < .05 differences between treatment groups).
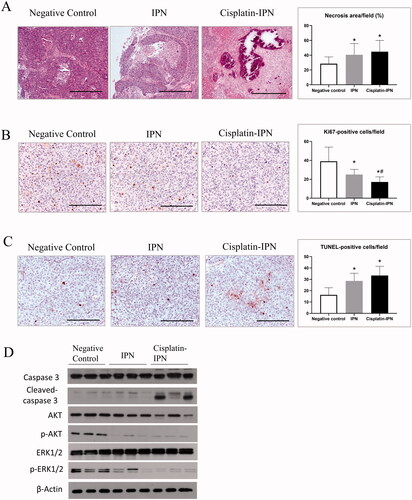
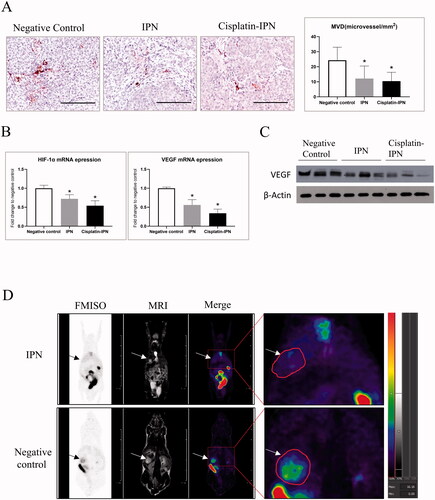
Figure 4. IPN hydrogel based TPVE suppressed tumor angiogenesis. (A) The MVD (microvessel density) was detected by anti-CD34 staining. Bar = 200 μm. The MVD per field in the tumors were compared from each group as shown in the bar chart. (B) The mRNA expression of intra-tumor HIF-1α and VEGFA were detected by RT-PCR. (C) The expressions of VEGF in the tumors from each group was detected by Western Blot. (D) The 18 F-FMISO uptake levels in IPN group and negative control group were captured by microPET-MRI scanning. (∗p < .05 differences between treatment group and negative control group).