Figures & data
Scheme 1. Schematic illustration of the self-assembled polymeric nanocarrier-mediated co-delivery of metformin and doxorubicin for melanoma therapy.
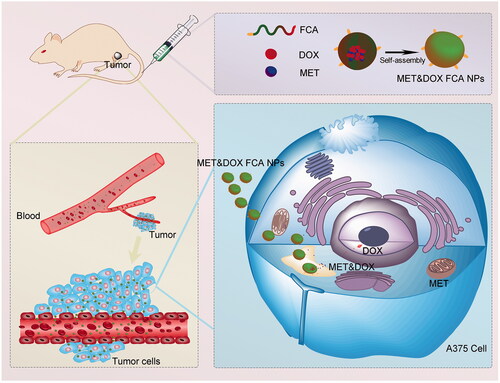
Figure 1. Preparation and characterization of the FCA NPs. (A) Schematic illustration of the formulation of FCA. (B) 1H NMR spectra of FCA. (C) Representative TEM images of the CA NPs, FCA NPs (pH 5.0) and FCA NPs (pH 7.4) (scale bars: 200 nm). Size distributions of the CA NPs, FCA NPs (pH 5.0) and FCA NPs (pH 7.4) measured using a Mastersizer Micro. (D) Zeta-potentials of the CA NPs, FCA NPs (pH 5.0) and FCA NPs (pH 7.4). (E) Intuitive images of the hemolysis assay. (F) Stability of the FCA NPs in the serum at indicated times, n = 3 for each group. All values are presented as the mean ± SD.
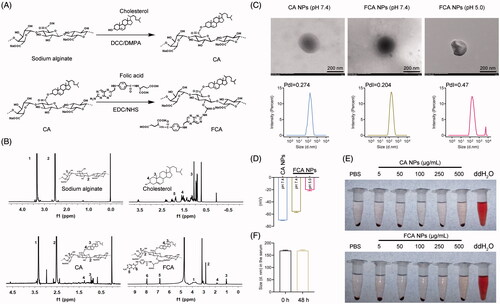
Figure 2. In vitro and in vivo toxicity of the FCA NPs. (A) Cell viability of the human A375 cells treated with indicated doses of CA NPs and FCA NPs. The ND mice were treated with FCA NPs (25 mg/kg body weight, i.v. injected every 3 days) for a total of 21 days. (B) Body weight gain. (C) Serum levels of transaminases. (D) Serum levels of creatinine and BUN. (E) CBC analysis. (F) Representative images of the H&E staining for the heart, liver, spleen, lung, and kidney sections (scale bars: 100 μm); n = 6 for each group. All values are presented as the mean ± SD.
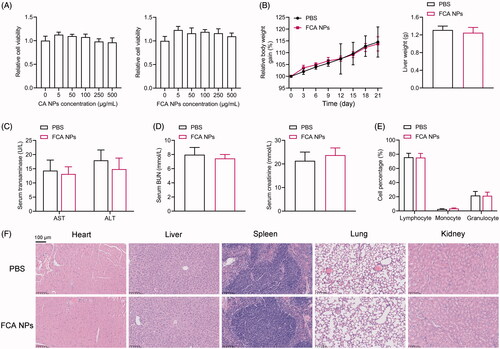
Figure 3. Cellular distribution and uptake of the FCA NPs. (A) CLSM images of the colocalization of human A375 cells and FCA NPs for 1, 4, 6, and 12 h (scale bars: 25 μm). (B, C) Cell uptake and quantitative analysis of the mean fluorescence intensity by flow cytometry for 1, 4, 6, and 12 h. (D) Representative fluorescence microscopy images of human A375 cells treated with Cy5-labeled FCA NPs exclusively or in combination with indicated inhibitors (scale bars: 25 μm). (E) Fluorescence imaging of the biodistribution of the FCA NPs in vivo. (F) Fluorescence imaging of the major organs and tumors. Cy5-labeled FCA NPs: Cy5/FCA NPs.
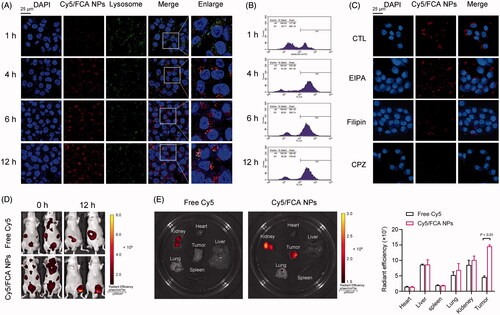
Figure 4. Evaluation of the antitumor activity in vitro. (A) Cell viability of the human A375 cells treated with free MET (x-axis). The viability of the A375 cells treated with MET, DOX, MET&DOX, FCA NP-loaded MET, FCA NP-loaded DOX, and FCA NP-loaded MET&DOX. (B) Cell viability of the human SK-MEL-28 cells treated with free MET (x-axis) and free DOX. The viability of the SK-MEL-28 cells treated with MET, DOX, MET&DOX, FCA NP-loaded MET, FCA NP-loaded DOX, and FCA NP-loaded MET&DOX. All values are presented as the mean ± SD. (C, D) TUNEL staining analysis of the human A375 and SK-MEL-28 cells after treatment with MET, DOX, MET&DOX, FCA NP-loaded MET, FCA NP-loaded DOX, and FCA NP-loaded MET&DOX. Scale bars: 50 μm. n = 6 for each group. CTL: FCA NPs, MET FCA NPs: FCA NP-loaded MET, DOX FCA NPs: FCA NP-loaded DOX, MET&DOX FCA NPs: FCA NP-loaded MET&DOX.
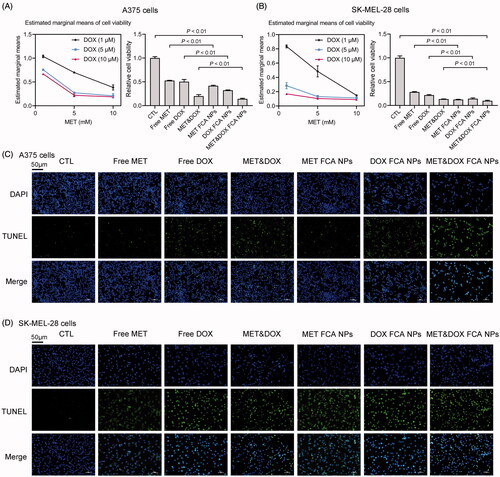
Figure 5. Evaluation of the antitumor activity in vivo. A xenograft melanoma tumor model was established. Different drug formulations were i.v. injected into the mice at 2-day intervals over 16 days. (A) Tumors volumes during the treatment. (B) Photos of tumor-bearing mice and dissected tumors after the16-day treatment. (C) Tumor weight. (D) H&E, Ki-67 (scale bars: 100 μm) and TUNEL (scale bars: 50 μm) staining of the corresponding tumor tissues obtained after different treatments. n = 5 for each group. CTL: FCA NPs, MET FCA NPs: FCA NP-loaded MET, DOX FCA NPs: FCA NP-loaded DOX, MET&DOX FCA NPs: FCA NP-loaded MET&DOX.
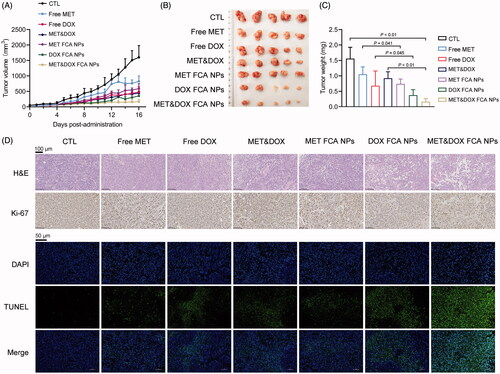
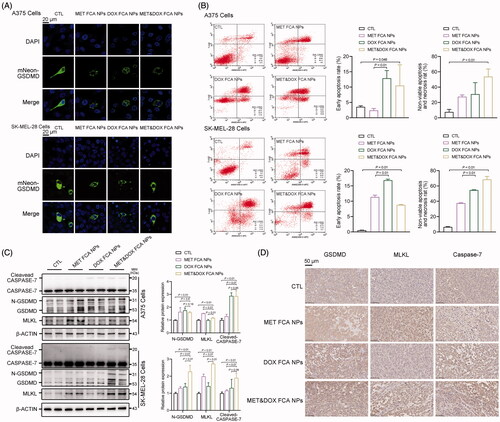
Figure 6. FCA NP-loaded MET&DOX induces melanoma cell death via induction of pyroptosis, apoptosis, and necroptosis (PANoptosis). (A) Representative confocal microscopy images of cleaving mNeon-GSDMD expressed in human A375 and SK-MEI-28 cells, scale bars: 20 μm. (B) Apoptosis and necroptosis of human A375 and SK-MEL-28 cells following 24-h incubation with different formulations; n = 3 for each group. (C) The protein expression levels of the GSDMD, CASPASE-7, and MLKL protein in human A375 and SK-MEL-28 cells following 24 h incubation with different formulations; n = 4 for each group. (D) IHC analysis of the GSDMD, Caspase-7, and MLKL protein expression in the corresponding tumor tissues obtained after the different treatments; scale bars: 50 μm, n = 5 for each group. CTL: FCA NPs, MET FCA NPs: FCA NP-loaded MET, DOX FCA NPs: FCA NP-loaded DOX, MET&DOX FCA NPs: FCA NP-loaded MET&DOX.