Figures & data
Table 1. Factors studied and respective levels investigated in the d-optimal design used for the preparation of EPL-loaded NLCs along with the responses and their required constraints.
Table 2. Composition of the prepared EPL-loaded NLCs and their own responses.
Table 3. Significance of different model terms appearing in the final reduced model for each response, along with the selected model and its evaluation.
Figure 1. (a) Effect of liquid lipid to solid lipid ratio a1, surfactant concentration a2, and surfactant type a3 on PS, (b) effect of liquid lipid to solid lipid ratio on PDI, and (c) effect of liquid lipid to solid lipid ratio c1 and surfactant type c2 on EE% of the prepared EPL-loaded NLCs systems.
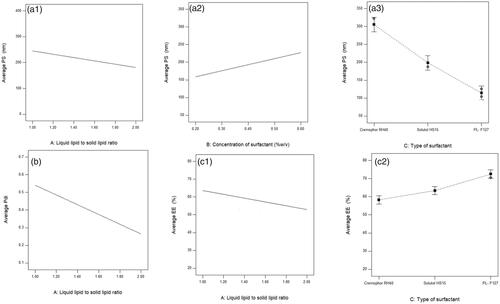
Figure 2. Cumulative release profile of EPL from the optimized EPL-NLCs system compared to EPL aqueous suspension.
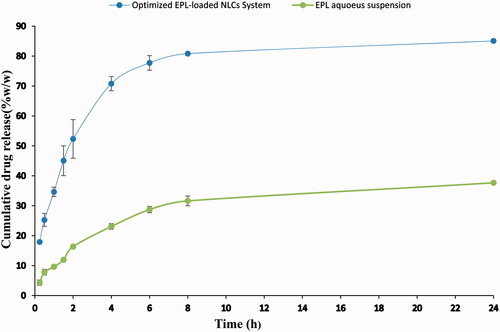
Figure 3. TEM images of the optimized EPL-loaded NLCs system.
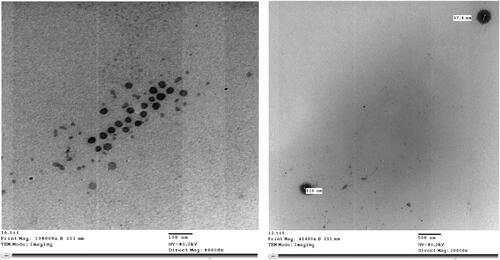
Table 4. Predicted values of the measured responses for the optimized formula compared to the actual values along with the prediction intervals and the residual value.
Figure 4. IR spectrum of (a) plain EPL, (b) physical mixture, and (c) freeze-dried optimized EPL loaded-NLCs system.
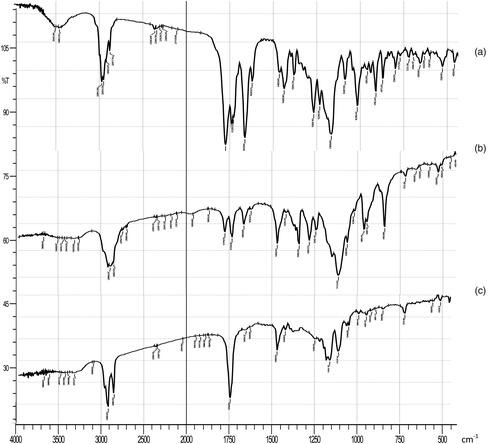
Figure 5. X-ray diffractogram of (a) plain EPL, (b) physical mixture, and (c) freeze-dried optimized EPL loaded-NLCs system.
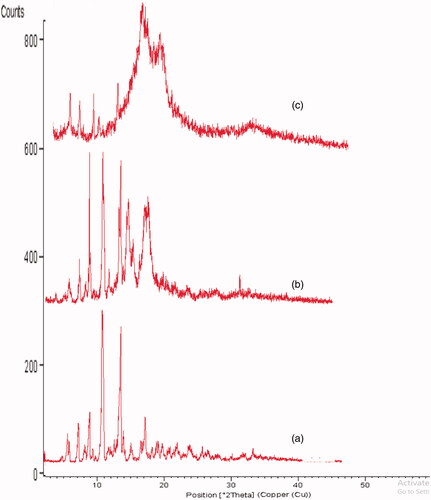
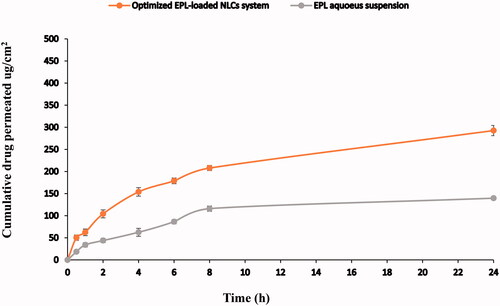
Figure 6. Ex vivo permeation profiles of EPL from optimized EPL-NLCs system (containing 5 mg EPL) through intestinal membrane in saline solution compared to EPL aqueous suspension.