Figures & data
Table 1. Effect of dependent factors on CIC-NLPs critical attributes (Y1–Y3) expressed as mean values ± SD, n = 3.
Figure 1. Experimental model for bronchial asthma induction and treatment scheme.
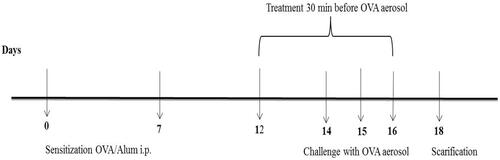
Figure 2. Solubility of CIC in various solid and liquid lipids (µg/ml).
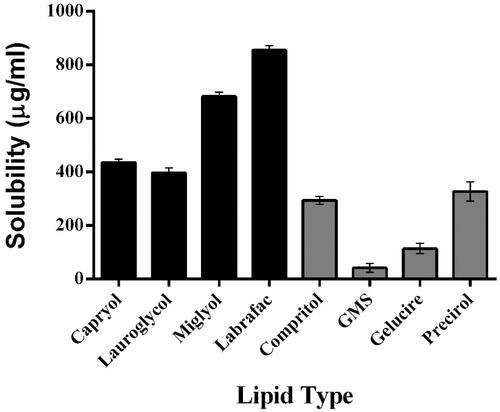
Figure 3. In vitro release profile of CIC loaded nanolipid particles (CIC-NLPs) in Gambleʼs solution of pH 7.4 containing 0.5%v/v Tween 80 at 37 °C (all points represent mean ± SD, n = 3).
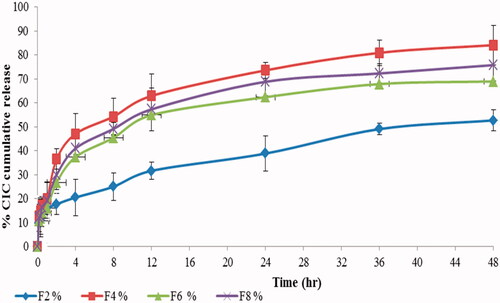
Figure 4. In vitro aerosol performance of nebulized CIC–NLP4 at 28.3 l/min using Anderson 8-stage non-viable cascade impactor.
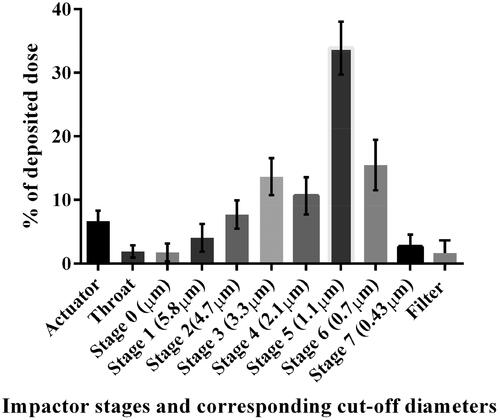
Figure 5. Effect of exposure of CIC–NLP4 with different concentrations of CIC on the viability of A459 cells determined by SRB assay. Each value represents the mean ± SD (n = 3).
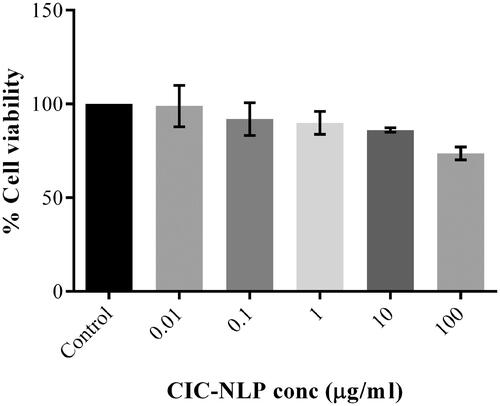
Table 2. Effect of CIC on total and differential cell counts in BALF of mice, expressed as mean values ± SD.
Figure 6. Effect of inflammatory markers in OVA-challenged mice. (A) Cytokines (IL4 and 13), (B) effect of CIC on serum IgE, and (C) effect of CIC on BALF TNFα and lung homogenate. *Significantly different (p<.05), **significantly different (p<.001).
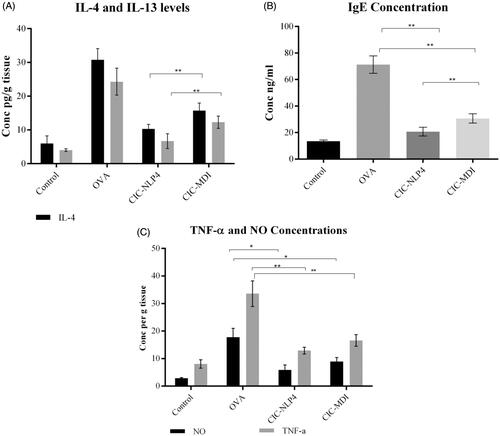
Figure 7. Effect of CIC on the oxidative stress biomarkers, MDA, and SOD in lung homogenate of OVA-challenged mice ± SD. **Significantly different (p<.001).
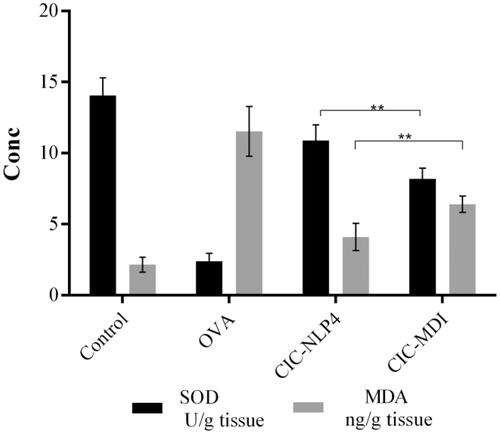
Figure 8. Effects of CIC on total NF-κB/p65. (A) Western blotting and (B) ratio to β-actin ± SD. *Significantly different (p<.05), **significantly different (p<.001).
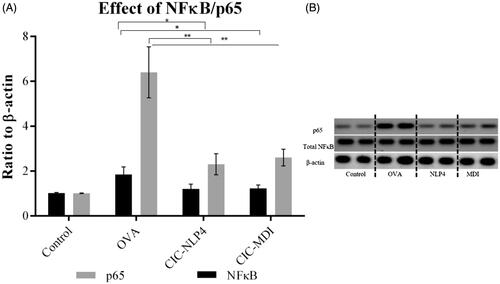
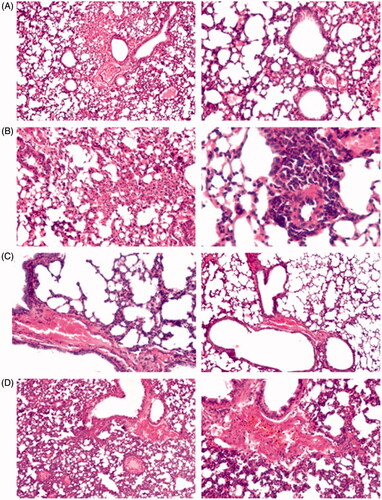
Figure 9. Representative histopathological changes in lungs obtained from mice of different groups showing the effect of CIC on: (A) control, (B) OVA-group, (C) NLP4, and (D) MDI.