Figures & data
Scheme 1. Schematic illustration of the preparation of DOX@Gd-MFe3O4 NPs and magnetic tumor targeted T1/T2 MR imaging guided synergistic cancer therapy.
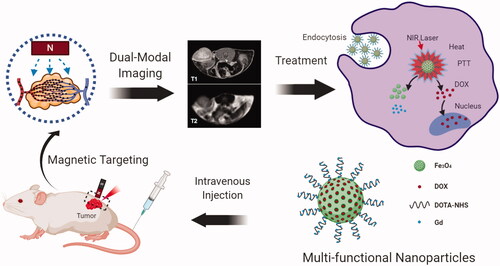
Figure 1. Characterizations of Gd-MFe3O4 NPs: (A) TEM image of MFe3O4 NPs; (B) TEM image of Gd-MFe3O4 NPs; (C) size distribution of MFe3O4 and Gd-MFe3O4 NPs; (D) nitrogen adsorption–desorption isotherm of the MFe3O4 NPs; (E) XRD pattern of MFe3O4 NPs; (F) EDS analysis of Gd-MFe3O4 NPs; (G) XPS spectra of Gd-MFe3O4 NPs; (H) magnetization curve of the MFe3O4 and Gd-MFe3O4 NPs; (I) UV–-vis–NIR absorbance spectra of DOX, MFe3O4, Gd-MFe3O4, DOX@Gd-MFe3O4 NPs.
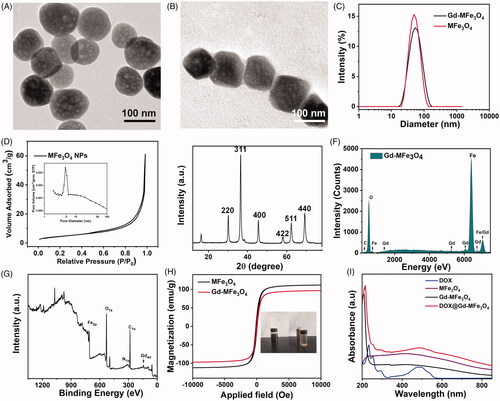
Figure 2. Photothermal effect of Gd-MFe3O4 NPs: (A) temperature change in MFe3O4 and Gd-MFe3O4 NPs suspension at the same concentration (0.25 mg/mL) under NIR laser irradiation (5 min, 1.5 W/cm2); (B) infrared thermal images of Gd-MFe3O4 NPs suspension of varying concentrations exposed to NIR laser (1.8 W/cm2) for 0–5 min. (C) Temperature elevation in Gd-MFe3O4 NPs suspension at gradient concentrations NIR laser irradiation (5 min, 1.5 W/cm2). (D) Temperature elevation in Gd-MFe3O4 NPs suspension (0.25 mg/mL) at different intensities of NIR laser irradiation. (E) Photothermal stability of Gd-MFe3O4 NPs suspension (0.25 mg/mL) under repeated NIR laser irradiation for four cycles.
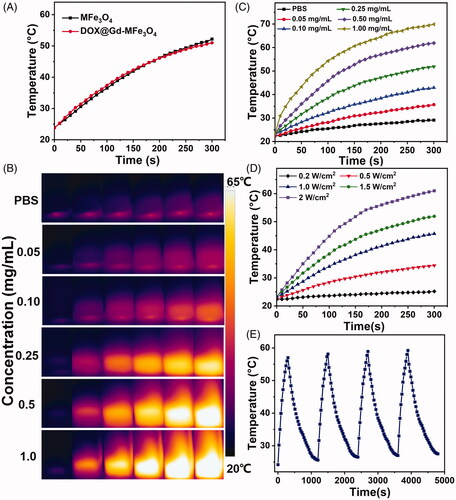
Figure 3. In vitro DOX release from DOX@Gd-MFe3O4 NPs in the presence and absence of NIR laser (2 W/cm2, 5 min). Values are expressed as mean ± SD (n = 3).
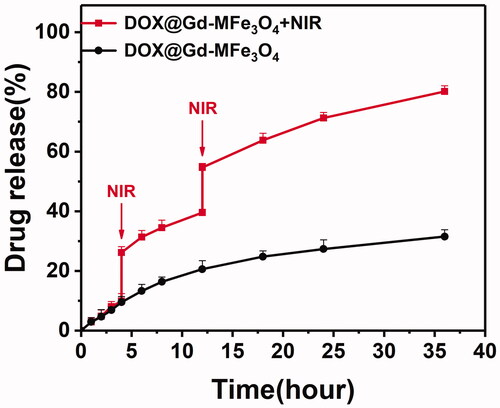
Figure 4. T1 longitudinal and T2 transverse relaxivities: (A) T1 and T2-weighted phantom images of Gd-MFe3O4 NPs using a 3.0 T MR scanner; (B) T1 longitudinal relaxation rate of Gd-MFe3O4 NPs with different concentrations of Gd; (C) T2 transverse relaxation rate of Gd-MFe3O4 NPs with different concentrations of Fe.
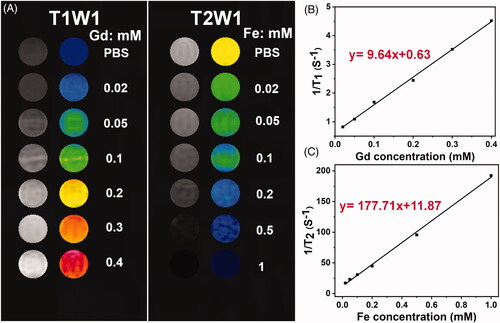
Figure 5. In vitro cellular uptake behavior of DOX@Gd-MFe3O4 NPs: (A) confocal microscopy images of the cellular uptake of DOX@Gd-MFe3O4 NPs (DOX= 5 μg/mL) 4T1 cells, scale bar = 20 μm. (B) Prussian blue staining of 4T1 cells in the presence and absence of magnetic field after 2 h incubation of Gd-MFe3O4 NPs with different concentrations (scale bar = 20 μm).
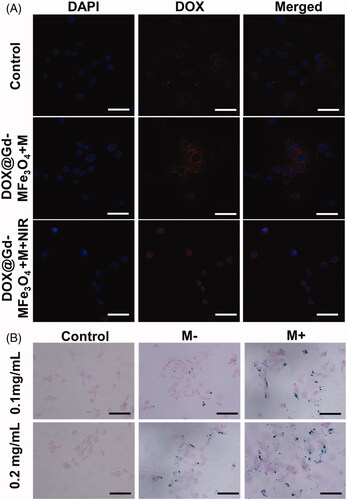
Figure 6. In vitro synergistic therapy for 4T1 tumor cells (A) Live/dead cells staining images of 4T1 cells after different treatments (0.25 mg/mL). The cells were co-stained with calcein AM and PI for live (green) and dead (red) cells, respectively. (B) Cell viabilities of 4T1 cells after different treatments with or without NIR. Values are expressed as mean ± SD (n = 4). (C) Cell viabilities of 4T1 cells after photothermal ablation with different NPs concentrations. Values are expressed as mean ± SD (n = 4).
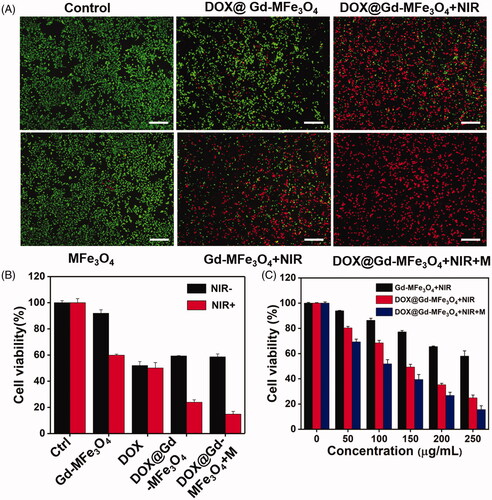
Figure 7. (A) In vivo MR imaging tests. (A) T1-weighted MR imaging of mice model with or without magnet after injection of Gd-MFe3O4 NPs at various time intervals; (B) T2-weighted MR imaging of mice model in the presence and absence of magnetic field at 4 h after injection of Gd-MFe3O4 NPs (C) T1-weighted MRI signals of the tumors at 0, 1, 2, 3, 4, 8, 12, and 24 h after administration of Gd-MFe3O4 NPs. Values are expressed as mean ± SD (n = 5).
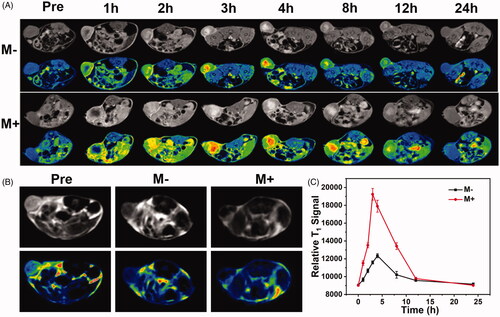
Figure 8. (A) Temperature changes in the tumor region under 808 nm laser irradiation at various injection; (B) relative tumor volumes of the 4T1 tumor bearing mice receiving various treatments for 14 days; (C) tumors excreted after 14-day with various treatments 1–7: saline, NIR, DOX@MFe3O4 NPs, DOX, MFe3O4 NPs + NIR, DOX@MFe3O4 NPs + NIR, DOX@MFe3O4 NPs + NIR + M; (D) Photographs of tumor bearing nude mice and the H&E staining of the tumor at 14 days for various groups, scale bar = 100 μm. Values are expressed as mean ± SD (n = 5).
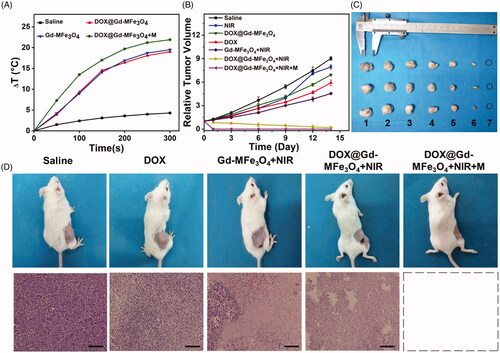
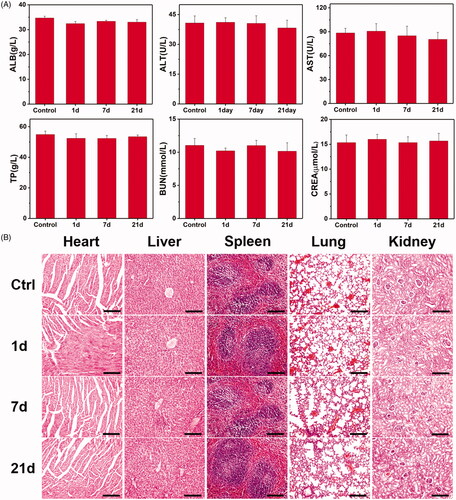
Figure 9. In vivo toxicity tests of Gd-MFe3O4 NPs: (A, a–f) mouse serum biochemistry analysis before (0d, control) and after injection of NPs for 1, 7, and 21 days. (B) Histological images of the heart, liver, spleen lung, and kidney of healthy mice 1, 7, and 21 days injected with Gd-MFe3O4 NPs and control mice. The organs were sectioned and stained with hematoxylin and eosin (H&E) and observed under a light microscope, scale bar = 100 μm.