Figures & data
Figure 1. The morphology study of prepared DMSN and SPRC@DMSN. The SEM of (A) and TEM of (B) DMSN (Scale bar = 50 nm). (C) The typical type-IV isotherm containing H1-type hysteresis indicated the preparation of mesopore structure in DMSN. (D) The Tyndall effect could be observed when DMSN and SPRC@DMSN dispersed in water and (E) the 7-day stability of DMSN and SPRC@DMSN in water. (F) The cumulative release of SPRC in PBS (pH = 7.4) within 96 h (n = 3, mean ± SD).
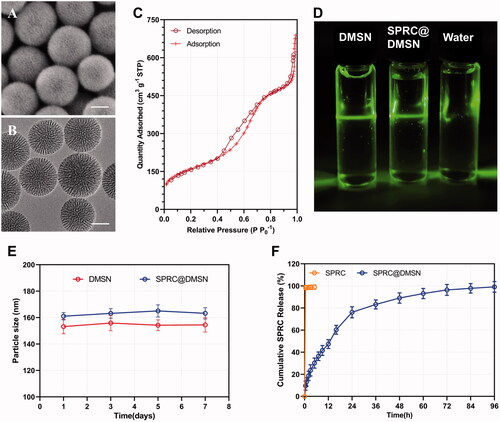
Table 1. The characterization of DMSN and SPRC@DMSN (n = 3, mean ± SD).
Figure 2. (A) The time-dependent cellular uptake of FITC labeled DMSN (Scale bar = 10 μm). (B) Cell viability after exposure to different concentration of SPRC and SPRC@DMSN. Significant different compared with corresponding group indicated as (*) (n = 3, mean ± SD).
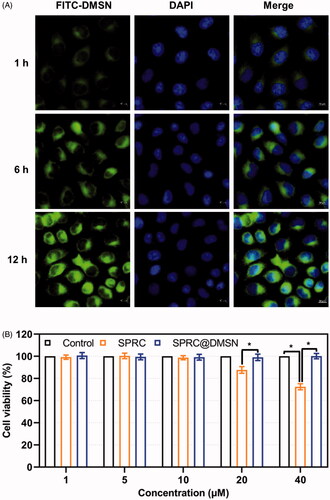
Figure 3. Supplementations exerted anti-inflammation effects via CSE/H2S pathway in vitro. (A, B) Changes of CSE expression after co-incubation with different supplementations. Significant different compared with control group indicated as (*), and significant different compared with LPS group indicated as (&) (n = 3, mean ± SD). (C) The H2S release in vitro after co-incubation with different supplementations (n = 3, mean ± SD). The pro-inflammatory cytokines levels of (D) TNF-α, (E) IL-1β, (F) IL-6, and anti-inflammatory cytokine level of (G) IL-10 were measured. Significant different compared with LPS treated group indicated as (*) (n = 3, mean ± SD).
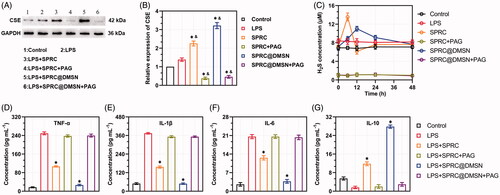
Figure 4. The supplementations promoted endogenous H2S release in plasma through CSE/H2S pathway after single administration. (A) The plasma concentration of SPRC within 72 h (above) and first 12 h (below). (B, C) Supplementations could elevate the CSE expression in heart and liver. (D) Administration of DMSN did not influence the H2S level in vivo, but (E) the administration of SPRC or SPRC@DMSN could elevated the plasma H2S concentration within 72 h (image of the first 12-h H2S plasma concentration was shown at bottom). SPRC or SPRC@DMSN were single oral administrated at dosage of 100 mg kg−1 according to rats’ body weight (n = 6, mean ± SD).
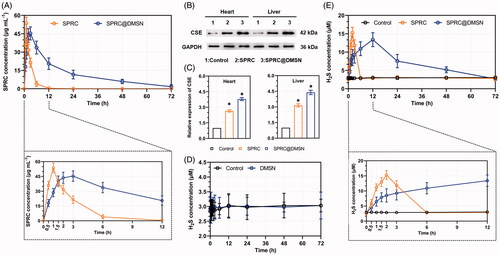
Table 2. Pharmacokinetic parameters of SPRC and SPRC@DMSN (n = 6, mean ± SD).
Figure 5. Supplementations mitigated AIA symptoms. The pro-inflammatory cytokines levels of (A) TNF-α, (B) IL-1β, and (C) IL-6 and anti-inflammatory cytokine level of (D) IL-10 in rats were measured. Significant different compared with AIA group indicated as (*) (n = 6, mean ± SD). (E) The arthritis index and (F) paw volume were used to evaluate the severity of swollen symptoms (n = 6, mean ± SD). (G) Safranin-O staining examination was conducted to evaluate the articular cartilage destruction. (Scale bar = 100 μm). (H) The micro 3 D analysis images of rats’ paws, 3 D reconstructions of paws from rats used the Mimics software. The erosions sites of bones indicated by the white arrow.
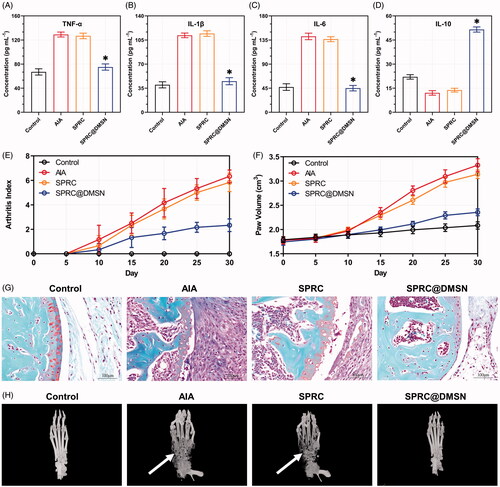
Figure 6. Evaluation of potential adverse effects of supplementations in AIA rats. (A) The body weight of rats was recorded every 5 days. After 30-day experiment, rats were sacrificed and (B) red blood cell (RBC), (C) white blood cell (WBC) count and (D) hemoglobin (HGB) were measured. (n = 6, mean ± SD). (E) H&E staining was carried out for the examination of heart, liver, spleen, lung, and kidney after 30 days’ experiment. Images were acquired at 200 × magnification (Scale bar = 100 μm).
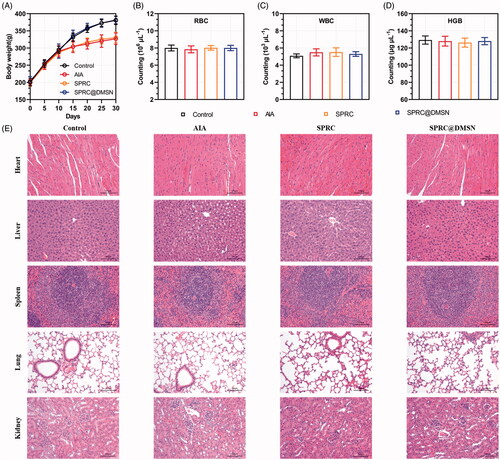
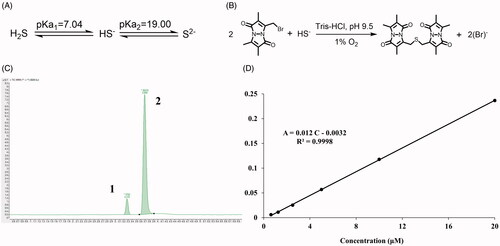
Figure 7. The detection of endogenous H2S via LC-MS. (A) The acid dissociation constant of H2S and (B) the mechanism of MBB react with HS− produce SDB at alkaline and hypoxia environment; (C) The chromatography of SDB, peak 1: SDB, peak 2: hydrocortisone (internal standard); (D) The calibration curve of SDB in different concentration (0.625 μM–20 μM).