Figures & data
Figure 1. Conceptual diagram of Do-AuNP effect in vitro and in vivo (intragastric gavage (i.g.), intraperitoneal (i.p.), or intratumoral injection (i.t.)).
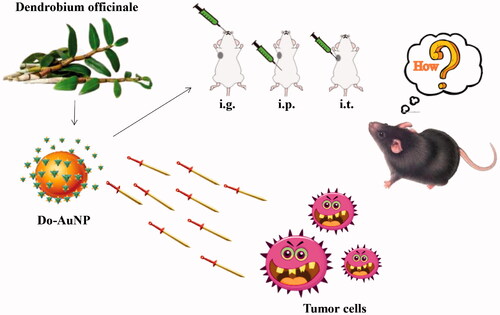
Figure 2. The UV–visible spectrum absorption pattern of Do-AuNP at different time.
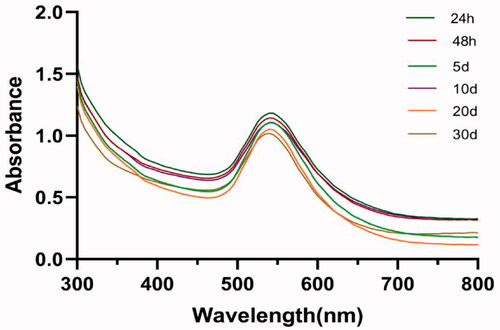
Figure 3. Particle size of Do-AuNP (A) photograph of high resolution transmission electron microscopy (TEM). (B) Dynamic light scattering (DLS) analysis. (C) Atomic force microscopy analysis (AFM).
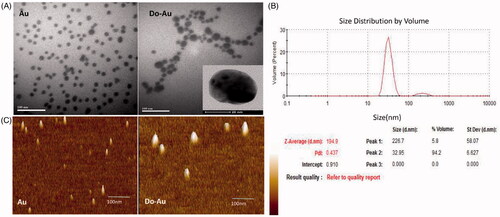
Figure 4. FTIR and EDAX of Do-AuNP (A) FTIR and (B) energy dispersive X-ray analysis (EDAX).
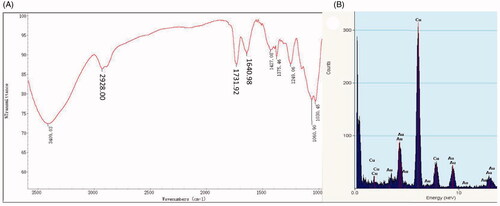
Figure 5. The cellular assays of Do-AuNP. (A) The inhibition rates of Do and Do-AuNP at various concentrations on HepG2 cells. (B) The survival rates of Do and Do-AuNP at various concentrations on L02 cells.
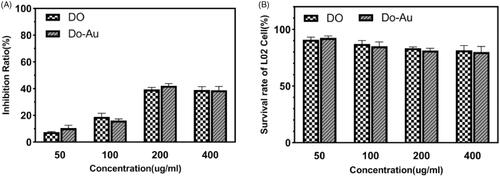
Figure 6. Gross tumor index. (A) Body weights during the 20 days. (B) Time-dependent tumor volume curves of different groups. (C) Photographs of tumors from nine different groups.
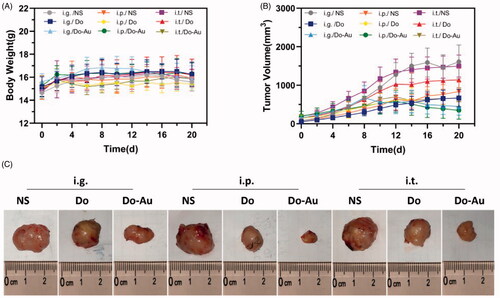
Figure 7. Tumor Index in vivo. (A) Tumor weights variability. (B) Inhibition ratio caused by treatments. (C, D) Spleen and thymus indexes of different groups. *p<.05, **p<.01 compared to the control.
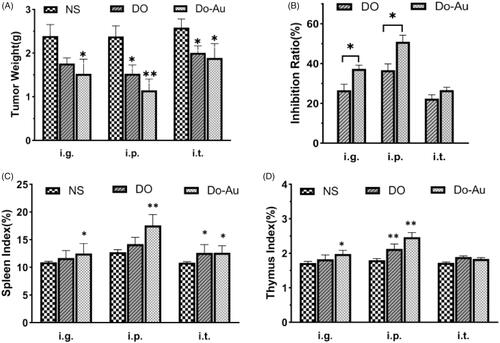
Figure 8. Histological index. (A) H&E, TUNEL, and Ki-67 staining of tumor. (B) Apoptotic index. (C) Proliferative index (*p<.05, **p<.01 compared to the control).
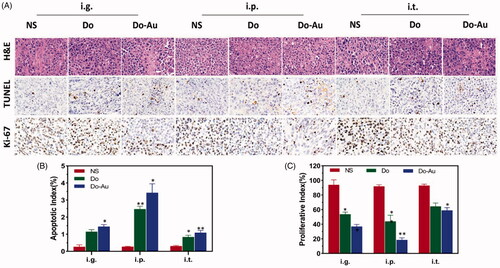
Figure 9. Bio-safety of material. (A–D) The blood biochemical analysis of ALT, AST, BUN, and CRE, respectively. *p<.05, **p<.01 compared to the control.
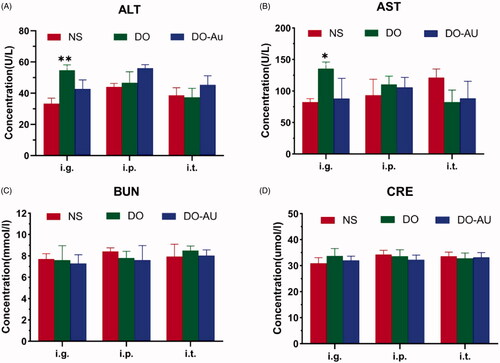
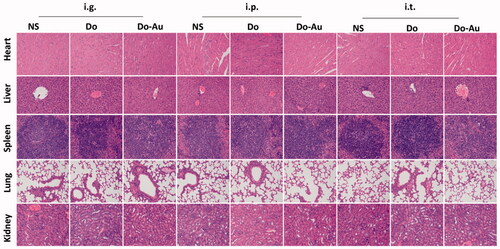
Figure 10. H&E staining photos of heart, liver, spleen, lung, and kidney in every treatment groups.