
Figures & data
Figure 1. The chemical structure of quercetin.
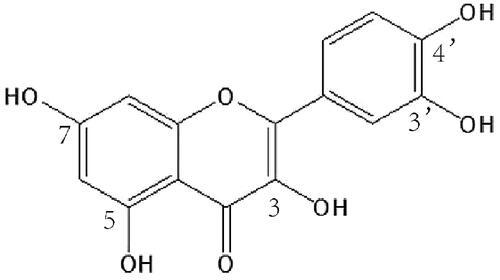
Table 1 The particle size and PDI value of Que-NSps prepared by antisolvent precipitation method and TZP beads grinding method.
Figure 2. TEM image of TPGS-Que-NSps (a), TPGS-SO-Que-NSps (b), SPC-Que-NSps (c), and SPC-Pip-Que-NSps (d).
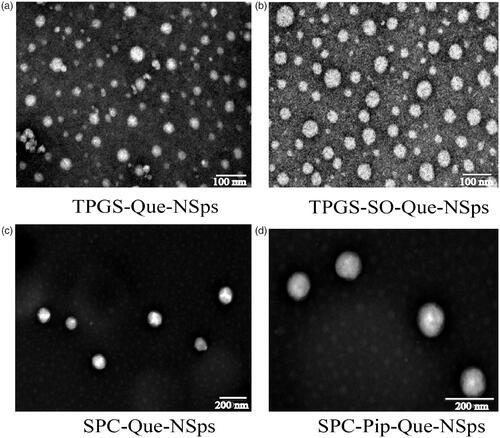
Figure 3. DSC thermograms and XRD patterns. (a) DSC thermograms of quercetin bulk powder, Pip, TPGS, SPC, SO, TPGS-Que-NSps, TPGS-SO-Que-NSps, SPC-Que-NSps, SPC-Pip-Que-NSps, and physical mixture (b) XRD patterns of quercetin bulk powder Pip, TPGS, SPC, SO, TPGS-Que-NSps, TPGS-SO-Que-NSps, SPC-Que-NSps, SPC-Pip-Que-NSps, and physical mixture.
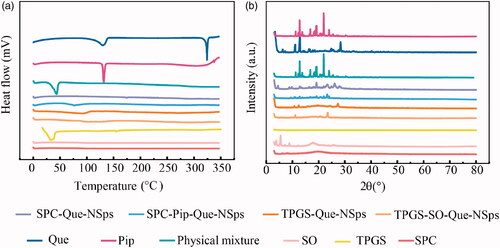
Figure 4. The stability of Que-NSps (mean ± SD, n = 3). Mean particle size change curves of Que-NSps during the storage at room temperature (a); the mean particle size change curves of Que-NSps during the incubation in artificial gastric fluid (b) or in artificial intestinal fluid (c) at 37 °C until 8 h; The concentration changes of Que in Que-NSps during the incubation in artificial gastric fluid or in artificial intestinal fluid at 37 °C until 8 h (d).
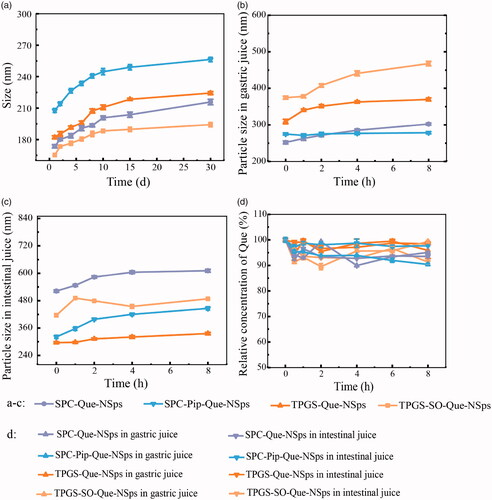
Figure 5. The in vitro drug release profiles of Que-NSps in PBS containing 0.1% (w/v) Tween 80 at 37 °C (a) and in artificial gastrointestinal juice containing 0.1% (w/v) Tween 80 at 37 °C (b) (mean ± SD, n = 3).
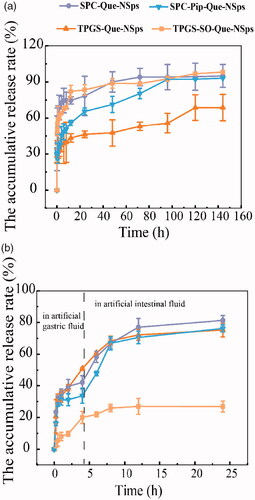
Figure 6. LC-MS chromatograms of Que, Iso and Que-glu in standard plasma sample (a), tested plasma sample (b), and blank plasma sample (c).
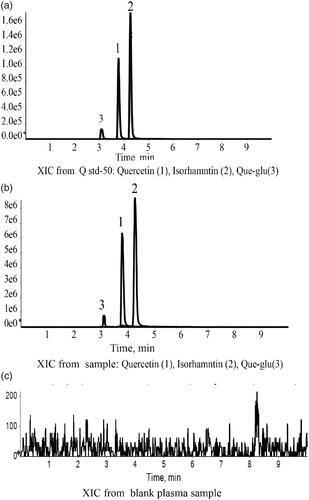
Figure 7. The mean plasma concentration-time curve of quercetin (a), Que-glu (b), and isorhamnetin (c) in rats after a single oral dose (50 mg/kg) of Que-NSps and Que-suspension (mean ± SD, n = 6).
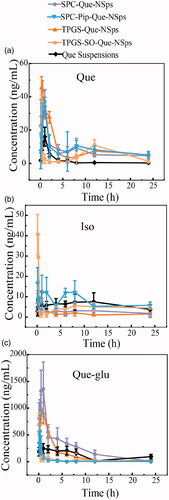
Table 2 Que pharmacokinetic parameters of all Que formulations in rat plasma.
Table 3. Pharmacokinetic parameters of Que-glu and isorhamnetin all Que formulations in rat plasma.