
Figures & data
Table 1. The independent factors and responses for the design of experiments.
Table 2. Compositions of the different chitosan oral gel samples/formulations.
Table 3. Solubility data of penciclovir (PV) in SNEDDS formulation components.
Figure 1. Pseudoternary-phase diagram in formulation components of penciclovir-loaded lavender oil-containing self-nanoemulsifying drug delivery systems (PV-LO-SNEDDS), using lavender oil (LO) as the oil phase, Labrasol:Labrafil 1944 in the ratio of 6:4 (HLB value = 10) as the surfactant mixture, and Lauroglycol-FCC as the co-surfactant.
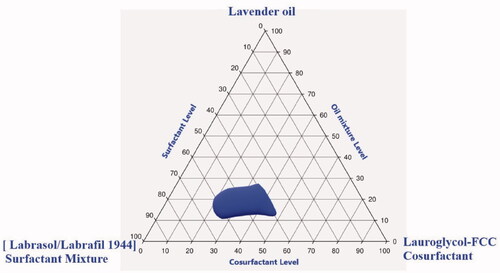
Table 4. The independent factors and responses for the design of experiments.
Table 5. ANOVA data for globule size of PV-LO-SNEDDS prepared in various runs.
Figure 2. Various design plots for the globule size and stability index of PV-LO-SNEDDS: (a) trace plot for globule size, (b) simplex contour plot for globule size, (c) 3D plot for globule size, (d) trace plot for stability index, (e) simplex contour plot for stability index, and (f) 3D plot for stability index.
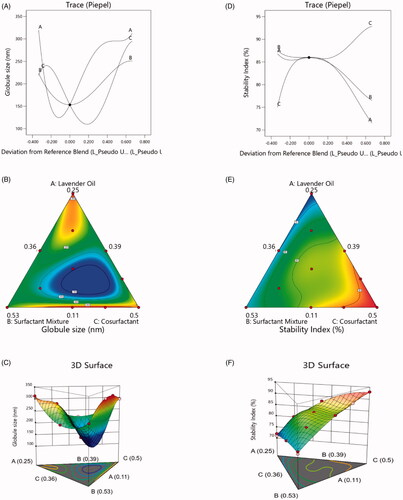
Table 6. ANOVA data for stability index of PV-LO-SNEDDS prepared in various runs.
Table 7. Optimum formula suggested for the PV-LO-SNEDDS formulation and the predicted and observed responses for the optimized formula.
Figure 3. Plots of the shear rate (G) versus the viscosity (η) for: (a) plain chitosan oral hydrogel (O1) and (b) chitosan oral hydrogel loaded with the optimized PV-LO SNEDDs (O3). Values are expressed as mean ± SD (n= 3).
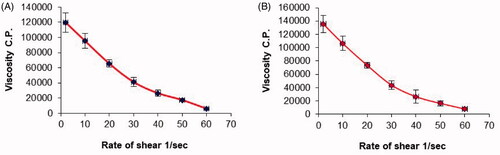
Table 8. Rheological parameters of plain chitosan hydrogel and chitosan hydrogel loaded with optimized PV-LO-SNEDDS.
Figure 4. Rheograms of (a) plain chitosan oral hydrogel (O1) and (b) chitosan oral hydrogel loaded with the optimized PV-LO-SNEDDs (O3).
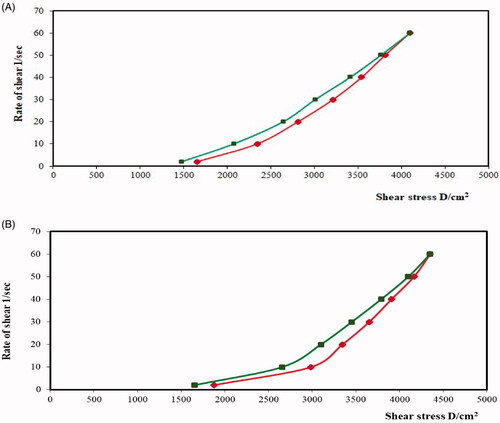
Figure 5. Plots of the logarithm of the shear rate (G) versus the logarithm of the shear stress (F) for (a) plain chitosan oral hydrogel (O1) and (b) chitosan oral hydrogel loaded with the optimized PV-LO-SNEDDs (O3). Values are expressed as mean ± SD (n= 3).
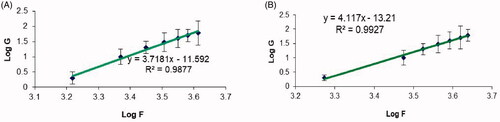
Figure 6. In vitro release profile of PV from chitosan hydrogel loaded with PV powder (O2), chitosan hydrogel loaded with optimized PV-LO SNEDDs (O3), marketed PV cream (1%), and 1% PV aqueous suspension. *Data are expressed as mean ± SD (n = 3).
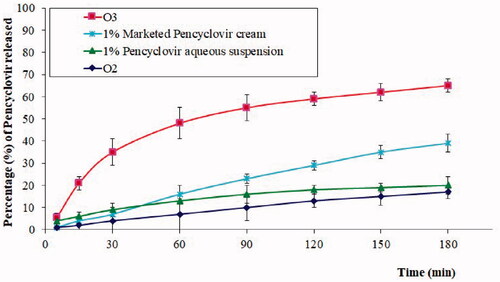
Table 9. Evaluation parameters of PV permeation across the buccal mucosa from different formulations.
Table 10. Comparative pharmacokinetic parameters of different PV formulations and marketed cream (mean ± SD, n= 6).