Figures & data
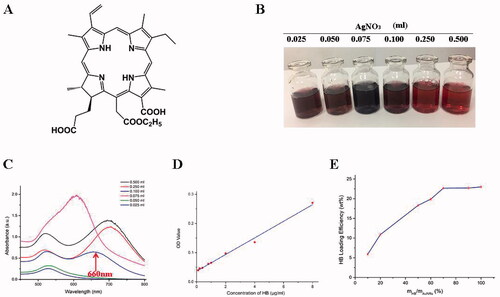
Figure 1. Synthesis of HB-AuNRs@cRGD. (A) Schematic diagram of HB structure. (B) Photographs and (C) UV absorption spectrum of AuNRs prepared by adding different concentrations of AgNO3. (D) Standard curve of HB concentration in ultrapure water. (E) HB-loading efficiency of HB-AuNRs@cRGD as a function of different mass ratio of HB/AuNRs.
Scheme 1. (A) Schematic illustrations of formation of HB-AuNRs@cRGD. (B) Mechanism of combined photothermal (PTT) and photodynamic therapy (PDT) by a single 660 nm laser irradiation.
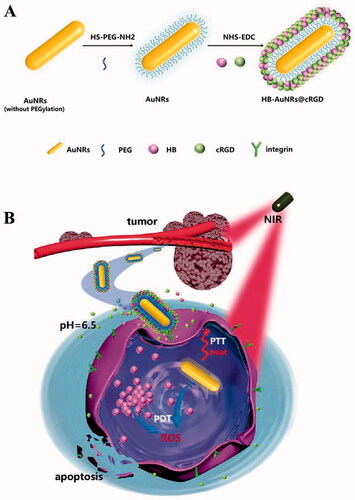
Figure 2. Characterization of HB-AuNRs@cRGD. (A) UV–vis spectra, (B) fluorescence emission spectra, (C) photographs, (D) surface charges (zeta-potential), and (E) size distribution of HB, AuNRs, and HB-AuNRs@cRGD.
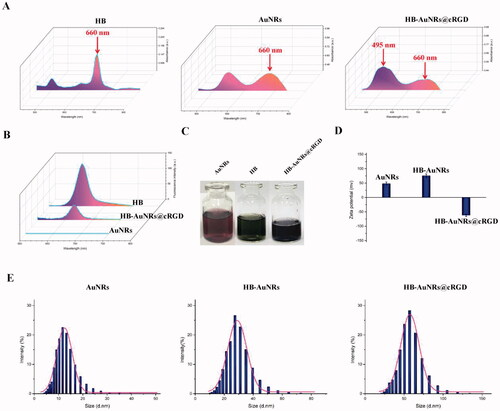
Figure 3. TEM and AFM images of HB-AuNRs@cRGD. (A) TEM and (B) AFM images of AuNRs and HB-AuNRs@cRGD.
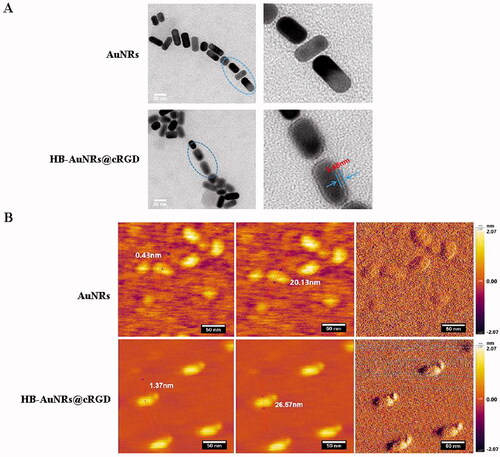
Figure 4. In vitro efficacy evaluation. (A–D) Photothermal performance of HB-AuNRs@cRGD. (A) Infrared thermographic images and (B) temperature change curves of different formulations exposure to 660 nm laser irradiation. (C) Infrared thermographic images and (D) temperature change curves of HB-AuNRs@cRGD at different concentrations exposure to 660 nm laser irradiation. (E, F) Time dependent (E) UV–vis spectra of mixture of HB-AuNRs@cRGD and DPBF, and (F) SO generation of HB-AuNRs@cRGD exposure to 660 nm laser irradiation. (G) Photographs of different formulations in PBS and DMEM.
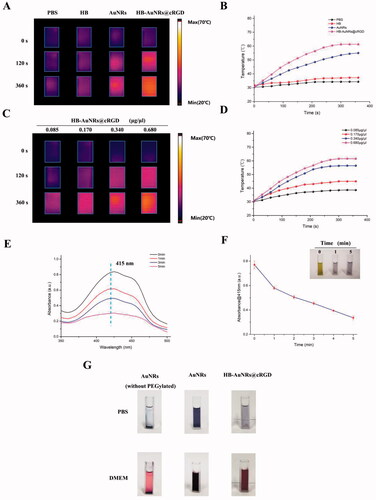
Figure 5. In vitro cytotoxicity evaluation. (A, B) Relative cell viability of ECA109 cells treated with different formulations (A) without and (B) with laser irradiation as a function of concentrations of HB. (C) CLSM images of calcein AM and PI co-stained ECA109 cells incubated with different formulations without and with laser irradiation. (D, E) Apoptosis analysis via Annexin V-FITC/PI assay of ECA109 cells incubated with different formulations without and with laser irradiation. Data are expressed as the mean ± SD (n = 3), *p< .05, **p< .01 vs. control.
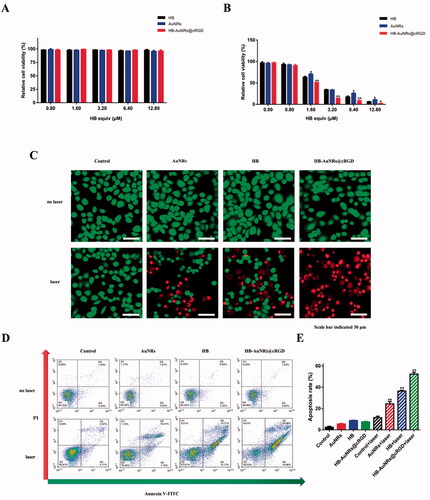
Figure 6. In vitro ROS generation, cellular uptake, and subcellular localization of ECA109 cells. (A) CLSM images of ECA109 cells incubated with different formulations using DCFH-DA under 660 nm laser irradiation for ROS generation. (B) CLSM images of ECA109 cells incubated with different formulations using JC-1 under 660 nm laser irradiation for mitochondrial membrane potential detection. (C) CLSM images of ECA109 cells incubated with PBS, HB, HB-AuNRs, and HB-AuNRs@cRGD (6.40 μM of HB equiv.) for 24 h. (D) Mean fluorescence intensity of ECA109 cells incubated with PBS, HB, HB-AuNRs, and HB-AuNRs@cRGD (6.40 μM of HB equiv.) for 24 h. (E) Subcellular localization of ECA109 cells incubated with HB-AuNRs@cRGD by CLSM observation.
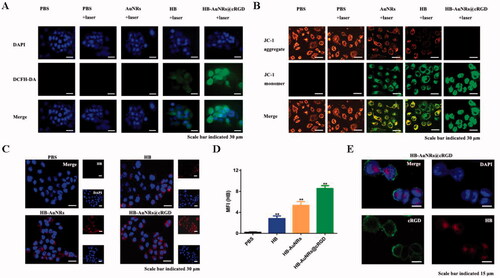
Figure 7. In vitro cell biological behavior evaluation. (A–C) Representative images of (A) wound healing assay, (B) colony formation assay, and (C) transwell invasion assay in different groups. (D–F) Quantitative analysis of (D) wound closure rate, (E) clone formation rate, and (F) invasion cells number. Data are expressed as the mean ± SD (n = 3), **p< .01 vs. control.
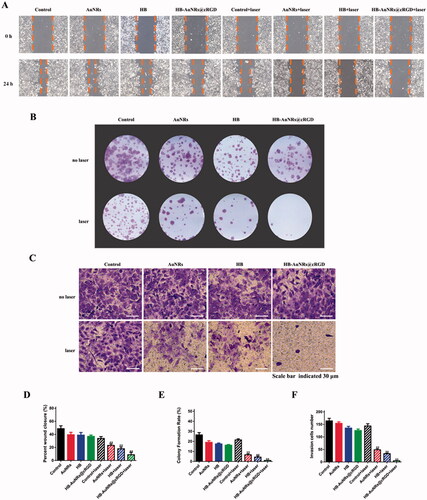
Figure 8. The bio-distribution of HB-AuNRs@cRGD. (A) In vivo fluorescent imaging of ECA109 tumor-bearing mice exposed to 660 nm laser at determined time intervals after i.v. administration of free HB and HB-AuNRs@cRGD. (B) Ex vivo fluorescent imaging and (C) fluorescence intensity of free HB and HB-AuNRs@cRGD in major organs and tumor tissues at 12 h after i.v. injection. Red circles indicated tumor areas. Data are expressed as the mean ± SD (n = 3), *p< .05, **p< .01 vs. control.
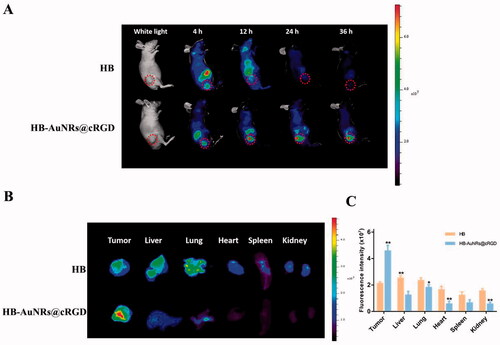
Figure 9. In vivo infrared thermal imaging and anti-tumor effect. (A) Infrared thermographic images of tumor-bearing mice under 660 nm laser irradiation for 0, 100, 300, and 500 s. Laser was irradiated at 12 h post i.v. injection of formulations. (B) Temperature variation curve at tumor sites after different treatment. (C) Representative photographs of ECA109 tumor-bearing mice from different groups during 15 days after treatment. (D) Photographs of sacrificed tumors from different groups during 15 days after treatment. (E) Tumor growth curves and (F) body weight change of ECA109 tumor-bearing mice from different groups during 15 days after treatment. Tumor volumes and body weight were normalized to their initial sizes and weight. Error bars represented the standard deviations of 6–8 mice per group, **p< .01 vs. control.
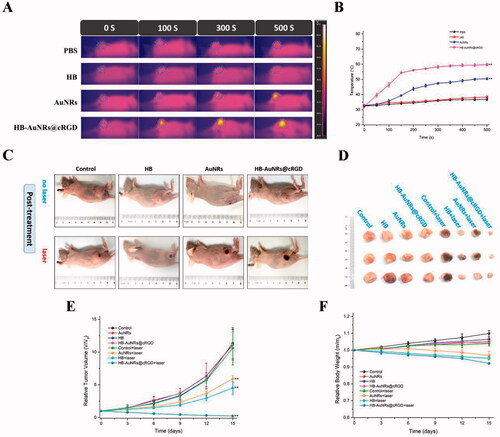
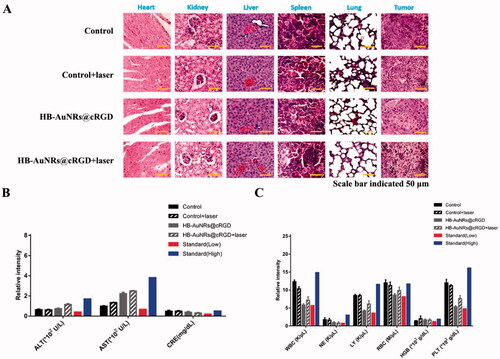
Figure 10. In vivo biosafety assessment. (A) H&E stained images of major organs and tumor tissue sections collected from different treatment groups on 15 days post-treatment. (B) The aspartate transaminase (AST), alanine aminotransferase (ALT), blood creatinine (CRE) analysis in the serum, and (C) the hematological parameters of the mice collected from different treatment groups on 15 days post-treatment. Error bars represented the standard deviations of three mice per group.