Figures & data
Figure 1. Detailed drug delivery process in vivo.
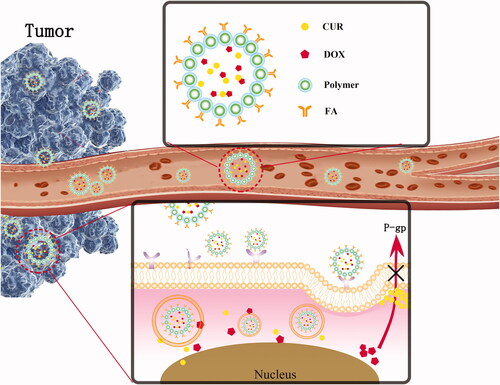
Figure 2. Reaction scheme for FA-TRI-PCL preparation.
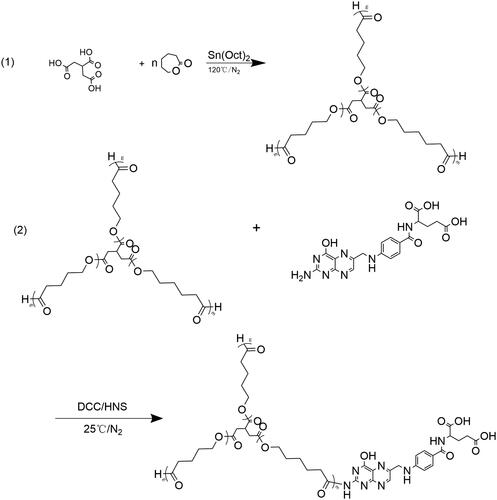
Figure 3. FT-IR spectra of TRI-PCL and FA-TRI-PCL.
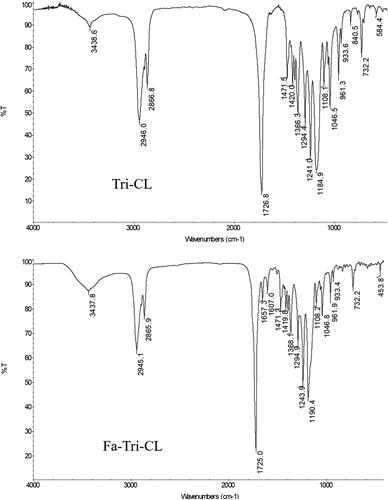
Figure 4. 1H NMR spectra of TRI-PCL and FA-TRI-PCL.
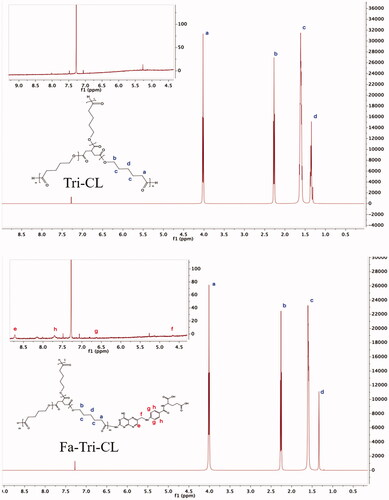
Figure 5. TEM photograph of (DOX + CUR)-FA-NPs (×15,000 magnification).
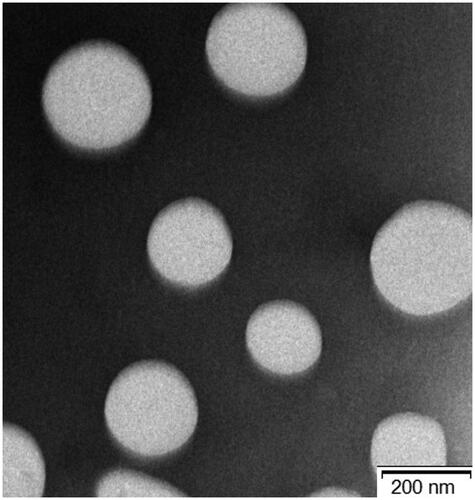
Figure 6. XRD curves of DOX, CUR, blank-FA-NPs, and (DOX + CUR)-FA-NPs.
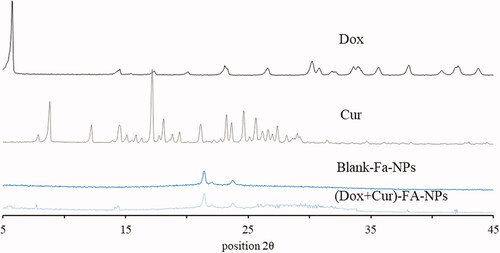
Table 1. Characterization of different nanoparticles.
Figure 7. Release curves of (DOX + CUR)-FA-NPs at different pH values.
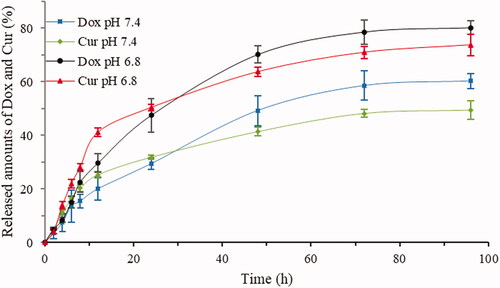
Figure 8. Cytotoxicity of the materials in the L929 cells.
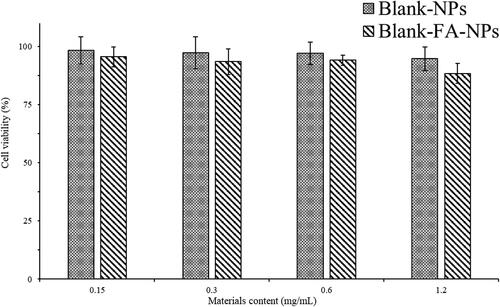
Figure 9. The antiproliferation effects of DOX, CUR, (DOX + CUR), (DOX + CUR)-NPs, and (DOX + CUR)-FA-NPs in the MCF-7 and MCF-7/ADR cells.
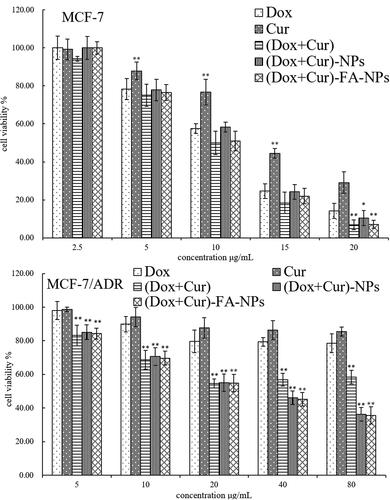
Table 2. The IC50 value of Dox, Cur, (Cur + Dox), (Cur + Dox)-NPs, and (Cur + Dox)-FA-NPs in MCF-7 cells and MCF-7/ADR cells.
Table 3. Resistance index and resistance reversal factor.
Figure 10. Flow cytometry analysis of the cellular uptake.
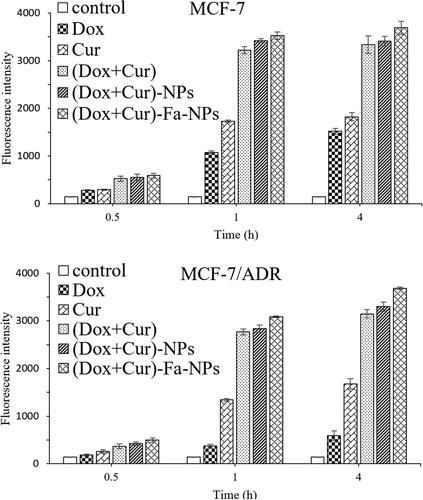
Figure 11. Biodistribution imaging of the whole body after IV injections with different drug formulations.
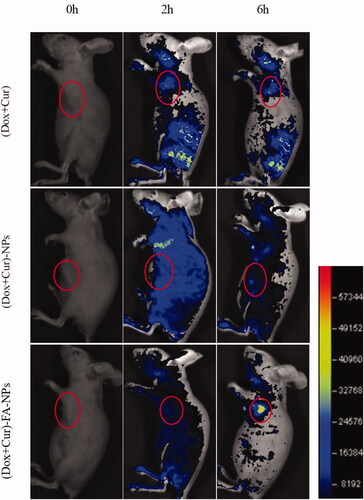
Figure 12. In vivo distribution of (DOX + CUR), (DOX + CUR)-NPs, and (DOX + CUR)-FA-NPs in the tissues. (a) Heart; (b) liver; (c) spleen; (d) lung; (e) kidney; (f) tumor.
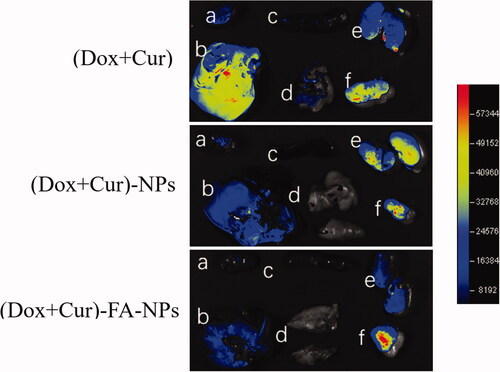
Figure 13. MCF-7/ADR tumor growth curves for the different drug formulations after the treatments.
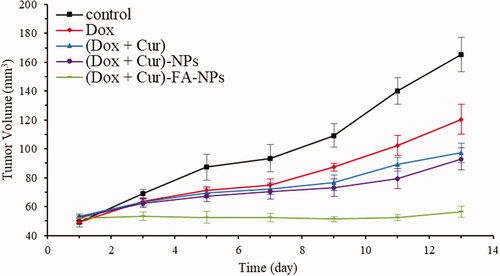
Figure 14. Photos of the tumors after various treatments.
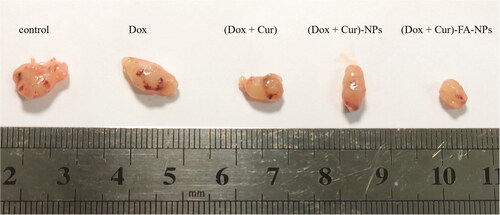
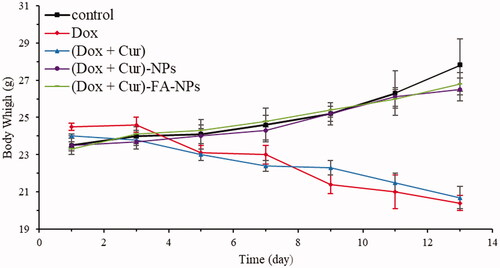
Figure 15. Body weights of the mice after treatments with various drug formulations.