Figures & data
Table 1. List of web servers used in the text.
Figure 1. Peptide P2 structure prediction. (A) Secondary structure prediction of peptide P2 was conducted by RaptorX webserver. (B) 3D structural model of peptide P2 predicted by I-TASSER based algorithms web server. (C) Ramachandran plot of peptide P2 modeled by I-TASSER web server. (D) Overall quality of predicted P2 structure checked by ERRAT analysis. (E) Molecular electrostatic potential illustrations of P2. Charge distribution across the peptide P2 surface from different angles are colored according to the intensity of electrostatic potential, stick diagrams of peptide P2 are buried within the semitransparent electrostatic surface maps, colored scale described their charge intensity (negative in red, positive in blue).
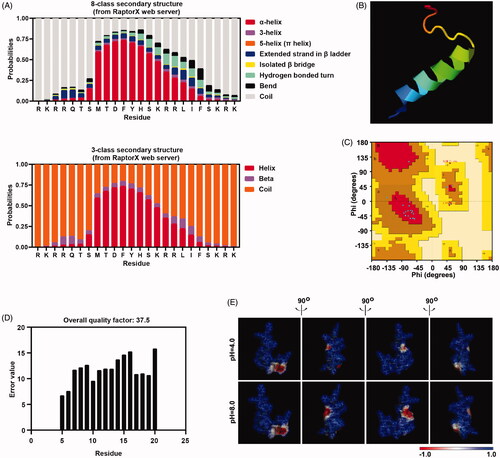
Figure 2. Cell penetrating peptide prediction. (A) CPP or non-CPP prediction of peptide P2 by CPPred-FL server. (B) CPP or non-CPP prediction of peptide P2 by SkipCPP-Pred server. (C) CPP or non-CPP and uptake efficiency prediction of peptide P2 by MLCPP server. (D) CPP or non-CPP and uptake efficiency prediction of peptide P2 by CPPred-RF server. (E) CPP prediction by using physiochemical properties-based SVM model and motif-based model.
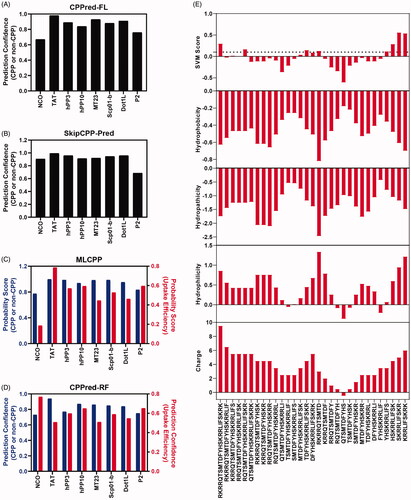
Figure 3. Cellular uptake of peptide P2. (A) Fluorescence microscopy images of FITC-labeled peptide P2 at indicated concentrations for 1 h. (B) Fluorescence intensity quantification of FITC-labeled peptide P2 at indicated concentrations for 1 h. Fluorescence intensity was normalized by protein concentration of cell lysate. All measurements (3 replications of each group) were normalized to the protein concentration of cell lysate, and error bars represent S.E.M., the one‐way analysis of variance (ANOVA) with Tukey–Kramer’s post hoc test was used to compare the differences. (C) Fluorescence microscopy images of FITC-labeled peptide P2 (5 µM) incubation with different time point. (D) Fluorescence intensity quantification of FITC-labeled peptide P2 (5 µM) incubation with different time points. Fluorescence intensity was normalized by protein concentration of cell lysate. All measurements (3 replications of each group) were normalized to the protein concentration of cell lysate, and error bars represent S.E.M., the one‐way analysis of variance (ANOVA) with Tukey–Kramer’s post hoc test was used to compare the differences. (E) Fluorescence intensity quantification of FITC-labeled peptide P2 (5 µM) with or without trypan blue incubation for 1 h. All measurements (3 replications of each group) were normalized to the protein concentration of cell lysate, and error bars represent S.E.M., the Student t-test was used to compare the differences. (F) Fluorescence intensity quantification of FITC-labeled peptide P2 (5 µM) incubated with or without 5% DMSO treatment for 1 h. All measurements (3 replications of each group) were normalized to the protein concentration of cell lysate, and error bars represent S.E.M., the Student t-test was used to compare the differences.
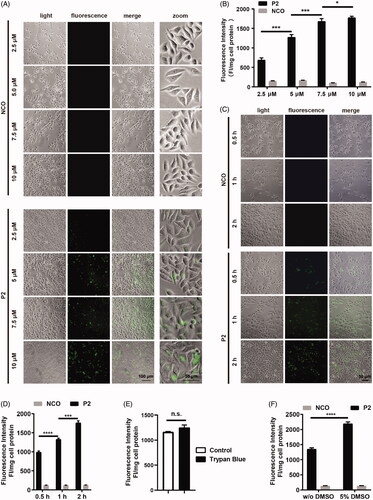
Figure 4. Cellular uptake of peptide P2 under different conditions. (A) Fluorescence microscopy images of FITC-labeled peptide P2 (5 µM) in different cell lines for 1 h. (B) Fluorescence intensity quantification of FITC-labeled peptide P2 (5 µM) in different cell lines for 1 h. All measurements (3 replications of each group) were normalized to the protein concentration of cell lysate, and error bars represent S.E.M., the one‐way analysis of variance (ANOVA) with Tukey–Kramer’s post hoc test was used to compare the differences. (C) Fluorescence microscopy images of FITC-labeled peptides (5 µM) other than peptide P2 for 1h. (D) Fluorescence intensity quantification of FITC-labeled peptides (5 µM) other than peptide P2 for 1 h. All measurements (3 replications of each group) were normalized to the protein concentration of cell lysate, and error bars represent S.E.M., the one‐way analysis of variance (ANOVA) with Tukey–Kramer’s post hoc test was used to compare the differences.
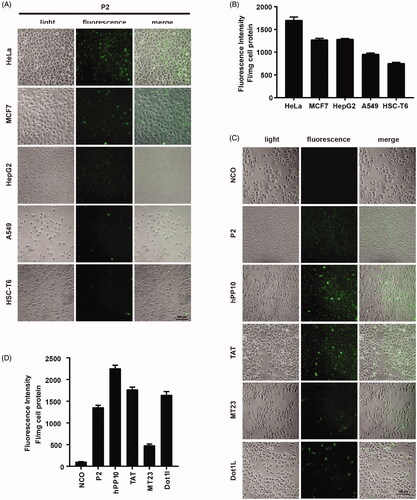
Figure 5. Involved pathway of cellular uptake of peptide P2. (A) Fluorescence microscopy images of FITC-labeled peptide P2 (5 µM) at different temperature for 1 h. (B) Fluorescence intensity quantification of FITC-labeled peptide P2 (5 µM) at different temperature for 1 h. All measurements (3 replications of each group) were normalized to the protein concentration of cell lysate, and error bars represent S.E.M., the one‐way analysis of variance (ANOVA) with Tukey–Kramer’s post hoc test was used to compare the differences. (C) Fluorescence microscopy images of FITC-labeled peptide P2 (5 µM) exposed with different inhibitors for 1 h. (D) Fluorescence intensity quantification of FITC-labeled peptide P2 (5 µM) exposed with different inhibitors for 1 h. All measurements (3 replications of each group) were normalized to the protein concentration of cell lysate, and error bars represent S.E.M., the one‐way analysis of variance (ANOVA) with Tukey–Kramer’s post hoc test was used to compare the differences.
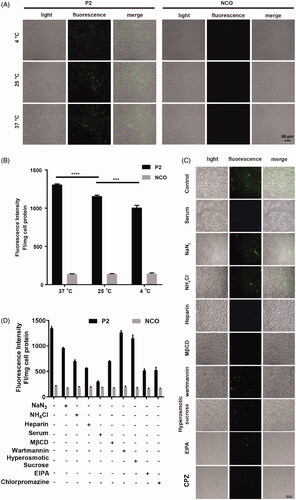
Figure 6. Cytotoxicity evaluation on peptide P2. (A) Cell viability assessment of HeLa cells incubated with the indicated concentration of peptide P2 after 24 and 48 hours. All measurements (3 replications of each group) were normalized to the protein concentration of cell lysate, and error bars represent S.E.M., the two‐way analysis of variance (ANOVA) with Bonferroni’s multiple comparison test was used to compare the differences. (B) Cell viability assessment of HepG2 cells incubated with the indicated concentration of peptide P2 after 24 and 48 hours. All measurements (3 replications of each group) were normalized to the protein concentration of cell lysate, and error bars represent S.E.M., the two‐way analysis of variance (ANOVA) with Bonferroni’s multiple comparison test was used to compare the differences. (C) LDH release assay of HeLa cells incubated with the indicated concentration of peptide P2, 0.1% Triton X-100 was used as a positive control. The baseline indicated in the plot represents negative control. (D) LDH release assay of MCF7 cells incubated with the indicated concentration of peptide P2, 0.1% Triton X-100 was used as a positive control. The baseline indicated in the plot represents negative control.
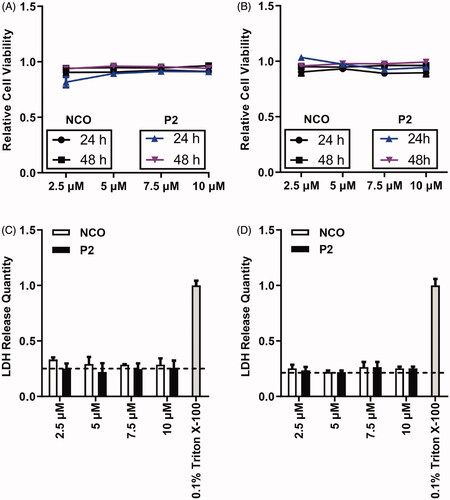
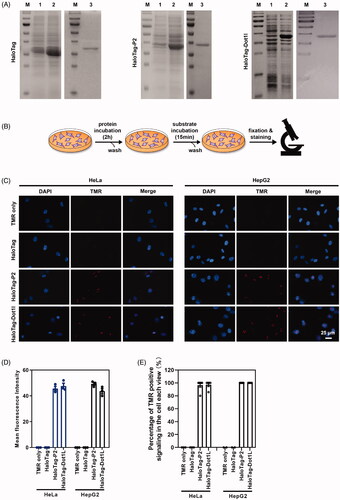
Figure 7. Peptide P2 mediate HaloTag delivery. (A) HaloTag, HaloTag-P2 and HaloTag-Dot1l protein preparation and purification. Lane 1 indicated non-induction, Lane 2 indicated IPTG induction, and Lane 3 indicated purified protein. (B) Schematic diagram of the protein treatment protocol and assessment thereafter. (C) Fluorescence microscopy images of peptide P2 (0.25 µg/ml) mediated HaloTag delivery for 2 h. (E) Quantification of fluorescence intensity of peptide P2 (0.25 µg/ml) mediated HaloTag delivery in the cell for 2 h. All measurements (3 replications of each group) were normalized to the protein concentration of cell lysate, and error bars represent S.E.M., the one‐way analysis of variance (ANOVA) with Tukey–Kramer’s post hoc test was used to compare the differences. (D) Percentage of TMR positive cells treated with proteins.