Figures & data
Figure 1. PRIME Device (A), the PRIME Device and Disposable Cartridge (B), and the Injection Process (C).
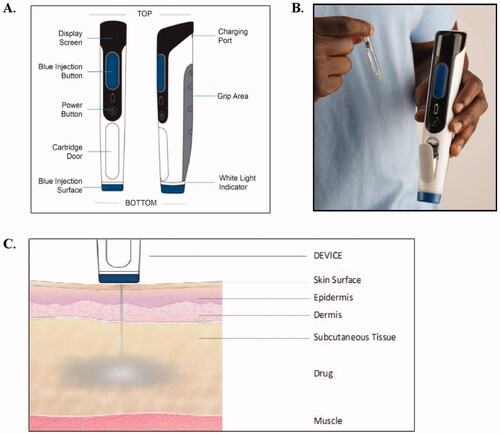
Table 1. Adverse events.
Figure 2. Distribution of VAS Pain Scores (in mm) at 0 minutes, 5 minutes and 10 minutes for Assigned (A) PRIME Needle-free and (B) Prefilled Needle & Syringe Injections.
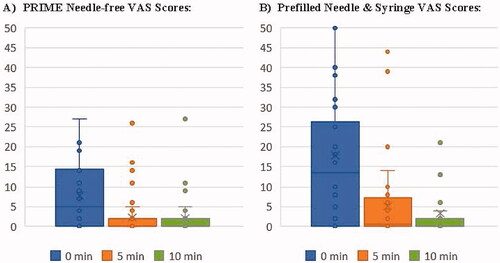
Table 2. Average VAS pain scores for PRIME and PFS study injections.
Table 3. Additional safety assessmentsa.
Figure 3. Preference. Response to the question: ‘When comparing the Needle-free Injector to the Prefilled Needle & Syringe, I:’.
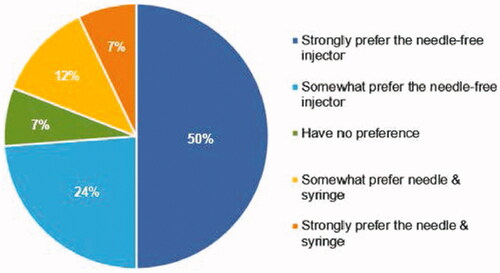
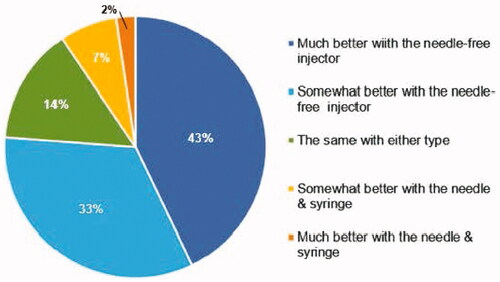
Figure 4. Ease of Use. Response to the question: ‘When comparing the Needle-free Injector to the Prefilled Needle & Syringe, it is:’.
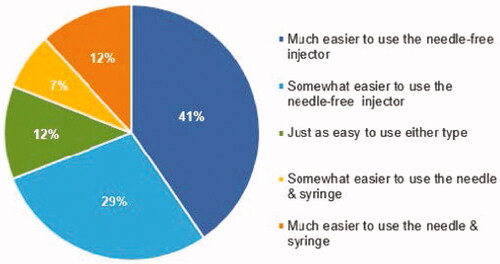
Figure 5. Quality of Life. Response to the questions: ‘If you had to inject yourself on a weekly basis because of a chronic illness, which device would you want your physician to prescribe?’.
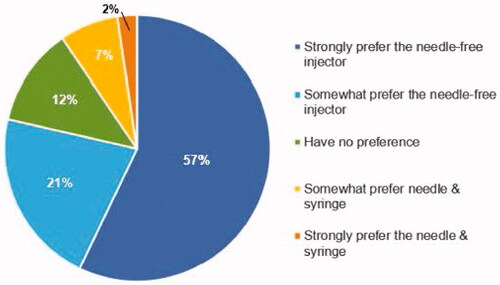
Figure 6. Medication Adherence. Response to the question: ‘I think the chances that I would take my medication would be:’.