Figures & data
Figure 1. Preabsorption risk assessment of Fraxinellone (Frax). (A) Log P of Frax under different gastrointestinal pH conditions. (B) Stability of Frax after incubation with stimulated gastrointestinal fluids in the presence or absence of enzymes at 37 °C. (C) Stability of Frax in the homogenates of various gastrointestinal segments at 37 °C. (D) Solubility of Frax in 50% (w/v) solution of different solubilizers in water at 37 °C. ***p < .001, compared with the drug solubility in water. ###p < .001, compared with G2-β-CD. Data are mean ± SD (n = 3 per group).
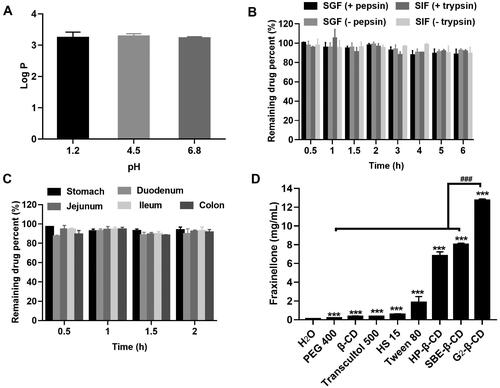
Figure 2. Characterization of CD-Frax complexes by phase solubility study and 1HNMR analysis. (A) Phase solubility diagrams of fraxinellone (Frax) at 37 °C in the presence of β-cyclodextrin (CD) (a), HP-β-CD (b), SBE-β-CD (c), or G2-β-CD (d). (B) Proton nuclear magnetic resonance (1H NMR) spectra of Frax (a), β-CD (b), HP-β-CD (c), SBE-β-CD (d), G2-β-CD (e), and the inclusion complexes β-CD-Frax (f), HP-β-CD-Frax (g), SBE-β-CD-Frax (h), and G2-β-CD-Frax (i).
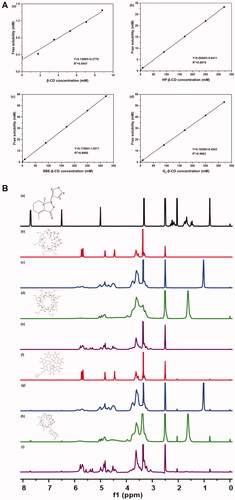
Figure 3. Characterization of CD-Frax complexes in the solid-state. Fourier-transform infrared spectra (FTIR) (A), powder X-ray diffraction pattern (P-XRD) (B), differential scanning calorimetry analysis (DSC) (C), thermal gravimetric analysis (TGA) (D) and field emission scanning electron microscopy analysis (FSEM) (E) of fraxinellone (Frax) (a), β-cyclodextrin (CD) (b), HP-β-CD (c), SBE-β-CD (d), G2-β-CD (e), and the inclusion complexes β-CD-Frax (f), HP-β-CD-Frax (g), SBE-β-CD-Frax (h), and G2-β-CD-Frax (i).
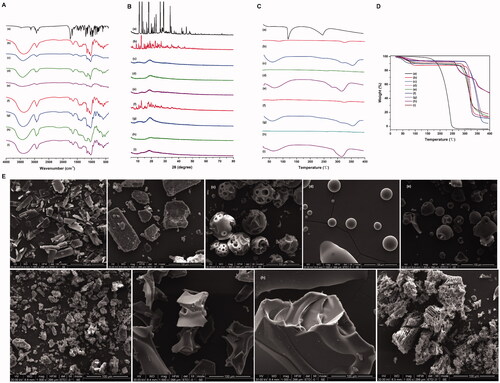
Figure 4. Docking studies to predict interactions between fraxinellone (Frax) and cyclodextrins (CDs) in inclusion complexes. (A) Structure of Frax. (B) Docking score of Frax with different CDs. (C) 3 D binding model between Frax and CDs with different orientations as obtained from docking calculations. Top, side, and bottom views of β-CD-Frax, HP-β-CD-Frax, SBE-β-CD-Frax, and G2-β-CD-Frax inclusion complexes are shown. Frax is shown in green, CDs in magenta, and hydrogen bonding as a blue dashed line.
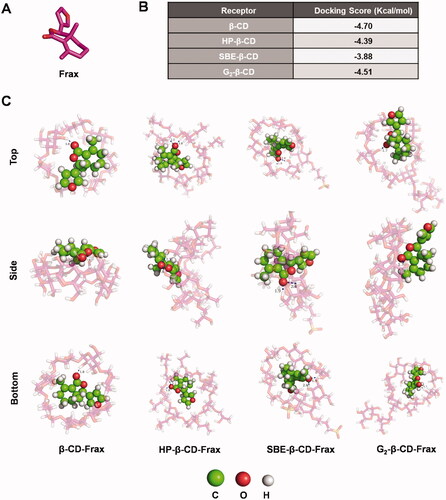
Figure 5. Release of fraxinellone (Frax) from CD-Frax complexes in vitro. Free Frax or CD-Frax complexes was dissolved at 37 °C in artificial gastric juice (A) (0.1 M HCl, pH 1.2) or phosphate-buffered saline at pH 6.8 (B) or 7.4 (C). Data are mean ± SD (n = 3 per group).
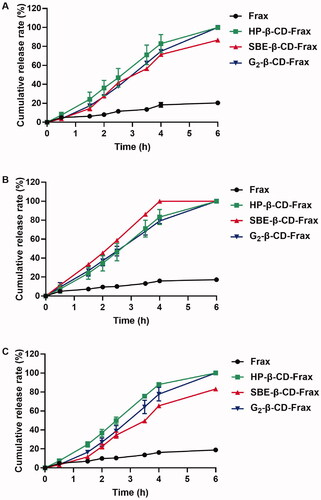
Figure 6. In vitro cell-based studies. (A) Cell viability after treatment with free Frax, CDs, or CD-Frax complexes for 4 h. (B) Cell uptake ability of free Frax, CDs, or CD-Frax complexes at a Frax concentration of 100 μg/mL 2 h post-drug treatment. **p < .01, *p < .05, compared with free Frax. #p < .05, compared with G2-β-CD-Frax. Data are mean ± SD (n = 3 per group).
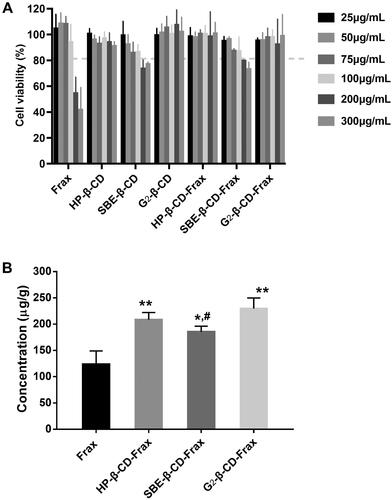
Figure 7. In vivo pharmacokinetic study. Mean plasma fraxinellone (Frax) concentration as a function of time in rats after intravenous injection of Frax (A) (10 mg/kg) or oral administration of Frax (150 mg/kg) or CDs-Frax (B) (150 mg/kg). Data shown are mean ± SD (n = 5 animals per group).
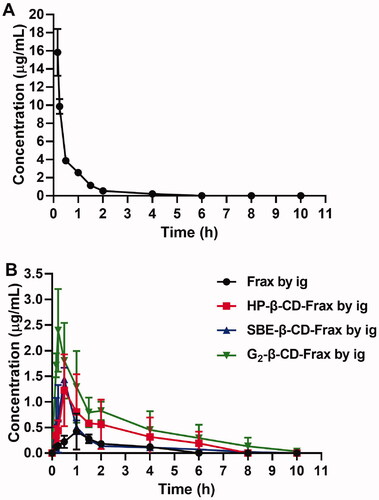
Table 1. Main pharmacokinetic parameters of free Frax in rats after intravenous injection (10 mg/kg) and after oral administration of Frax or CDs-Frax (150 mg/kg) (n = 5 animals per group).
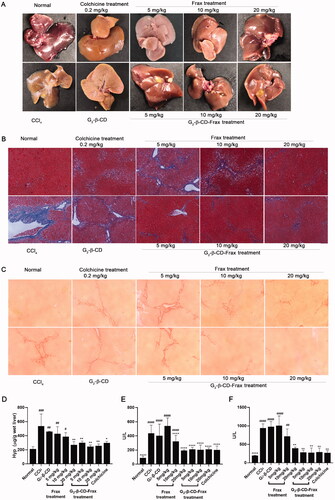
Figure 8. G2-β-CD-Frax improved anti-fibrosis efficacy of Frax on the CCl4-induced mouse model. Representative photos of liver tissues (A) and images of liver sections with Masson (B) and Sirius red staining (C). (Scale bars, 100 μm) (D) Concentration of liver HYP. (E) ALT and (F) AST levels in serum. ****p < .0001, **p < .01, *p < .05, compared with the CCl4-induced group. ####p < .0001, ###p < .001,##p < .01, #p < .05, compared with normal group. Data are mean ± SD (n = 3 per group).