Figures & data
Figure 1. In vitro cytotoxicity of TPL on HCC. (A) CCK-8 was used to determine the killing effect of TPL on Huh7 and Hep3B cells. (B) TPL (10 and 20 ng/ml) markedly inhibited colony formation of Huh7 and Hep3B cells. (C, D) TPL markedly inhibited cell proliferation of these two cells. (E) Apoptosis-associated proteins, including cleaved caspase 3/9 and Bad were induced by TPL in a dose-dependent pathway. (F) Flow cytometry showed markedly induced apoptosis by TPL in Huh7 and Hep3B cells. The bar indicated 100 μm.
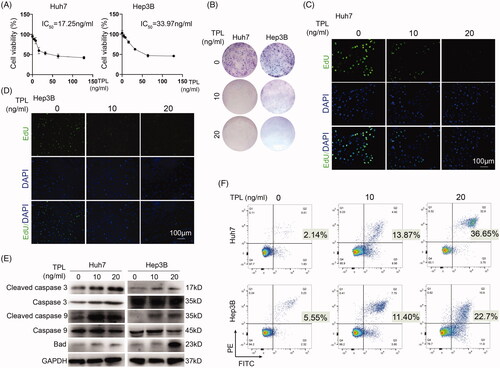
Figure 2. Antitumor mechanisms of TPL. (A) Heat map showed the transcriptome profiles of Huh7 cells treated with TPL (20 ng/ml) or not. (B, C) GSEA analysis showed that TPL led to the enrichment of apoptosis and necroptosis in Huh7 cells. (D) The key regulators of necroptosis, p-RIP1, p-RIP3 and p-MLKL were upregulated by TPL in a dose-dependent pathway in Huh7 and Hep3B cells. (E) Nec-1 (40 μM) inhibited the activity of p-RIP1 and p-MLKL induced by TPL. (F) Pretreatment of nec-1 did not improve the cell proliferation of Huh 7 cells in response to TPL (20 ng/ml). (G) Pretreatment of nec-1 improved the cell viability of Huh7 cells in response to TPL (20 ng/ml). (H) The Heat-map showed the differentiated necroptosis genes (belonging to the HSA04217 gene set) induced by TPL in Huh7 cells. (I) CYLD was upregulated by TPL while BIRC3 was downregulated by it in Huh7 and Hep3B cells. The bar indicated 100 μm. Nec-1, necrostatin-1; *p < .05.
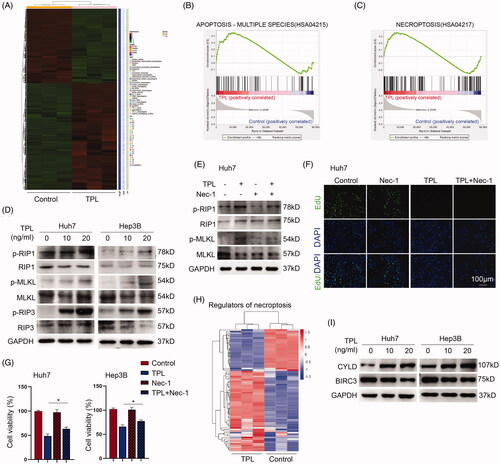
Figure 3. Characterization of liposomes and MP-LP. (A) TEM images, size distribution by dynamic light scattering and zeta potential of Lipo. (B) TEM images, size distribution by dynamic light scattering and zeta potential of MP-LP. (C) Comparison of particle size (peak), polymey disperse index and zeta potential (peak) of Lipo and MP-LP.
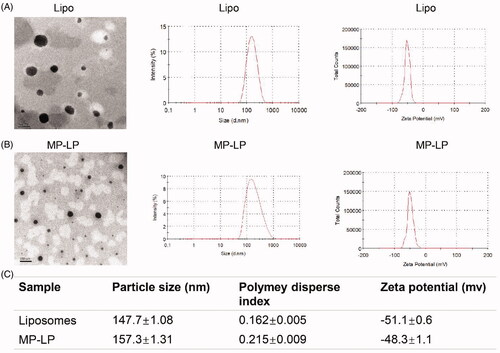
Figure 4. Cellular uptake study. (A) Cellular uptake of liposomes by Huh7 cells for different incubation hours. (B) Cellular uptake of MP-LP by Huh7 cells for different incubation hours. (C) Semi-quantitative analysis of cellular uptake of liposomes and MP-LP.
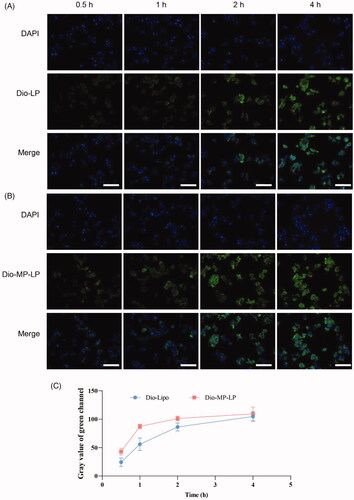
Figure 5. Biodistribution and tumor-targeting of nanoparticles. (A) In vivo biodistribution of DiR-labeled Lipo and MP-LP. (B) Ex vivo biodistribution and tumor accumulation of DiR-labeled Lipo and MP-LP. Blue arrow indicates the tumor site (C) Analysis of fluorescence intensity of DiR-labeled Lipo and MP-LP in major organs of HCC-bearing mice at different time points. ∗∗∗p < .001.
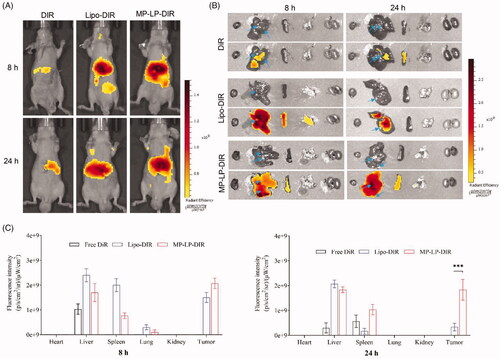
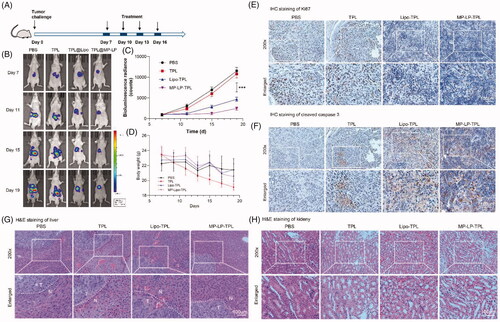
Figure 6. In vivo antitumor efficacy of TPL@MP-LP. (A) Treatment schedule of TPL@MP-LP for HCC-bearing mice. (B) Bioluminescence of HCC growth in mice (n = 6). (C) Quantitative analysis of bioluminescence showing tumor size in mice (n = 6). ∗∗∗ p < .001. (D) Body weight of mice before and after treatment (n = 6). (E) IHC analysis of Ki67 expression of the tumor site in the liver after treatments. TPL led to slightly less staining in liver tumor, and TPL@Lipo and TPL@MP-LP led to much less staining of Ki67 in liver tumor. (F) IHC analysis of cleaved caspase 3 expression of the tumor site in the liver after treatment. TPL@Lipo and TPL@MP-LP markedly improved caspase 3 expression in liver tumor. (G-H) H&E staining of liver tissues showed that TPL led to obvious liver and kidney injury, while it was not observed in the groups of Lipo-TPL and MP-LP-TPL. The bar indicated 100 μm.