
Figures & data
Figure 1. Illustration for the preparation of pH-responsive Spe@HNPs with layer-by-layer structure and drug delivery for acute lung infection treatment.
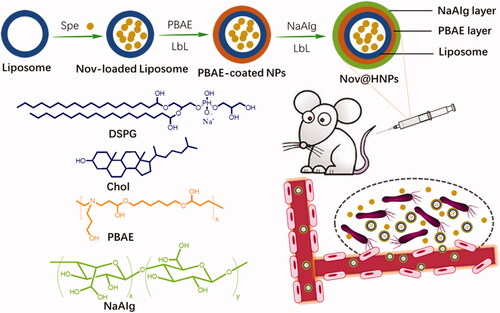
Figure 2. Characterization of Spe@HNPs system. Particle size (A), polydispersity index (PDI, B), and charge reversal in zeta-potential (C) of Spe-loaded liposomes, single-layered NPs, and Spe@NPs. The data are shown as mean ± s.d. (n = 3 independent experiments). (D) SEM image of Spe@NPs (insert: scale bar: 100 nm).
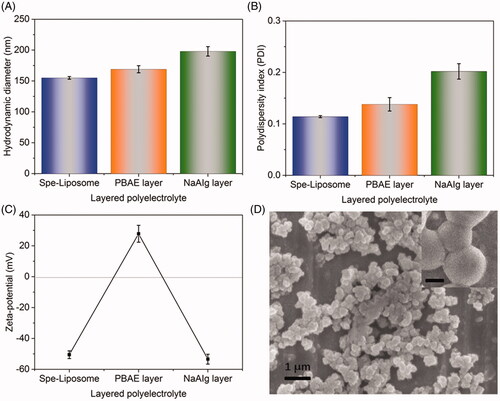
Table 1. Spe loading capacity of Spe@NPs at different mass ratios.
Figure 3. Evaluation of pH-responsive property and stability of Spe@NPs system. The hydrodynamic diameters (A) and zeta-potential (B) of Spe@HNPs at different conditions. Hydrodynamic diameters (C) and PDI (D) of Spe@HNPs after incubation in PBS (pH 7.4) with 20% FBS at 37 °C for 5 days. The data are shown as mean ± s.d. (n = 3 independent experiments).
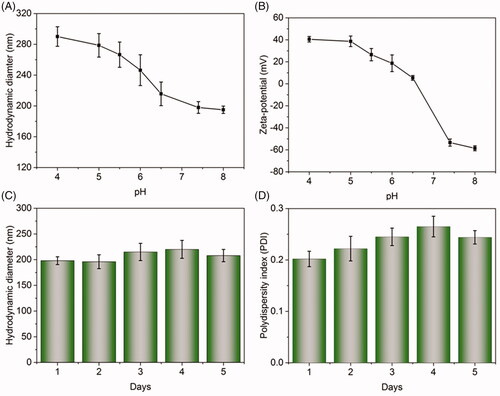
Figure 4. In vitro pH-triggered drug release performance of Spe@HNPs at pH 7.4 and 6.0. The data are shown as mean ± s.d. (n = 3 independent experiments).
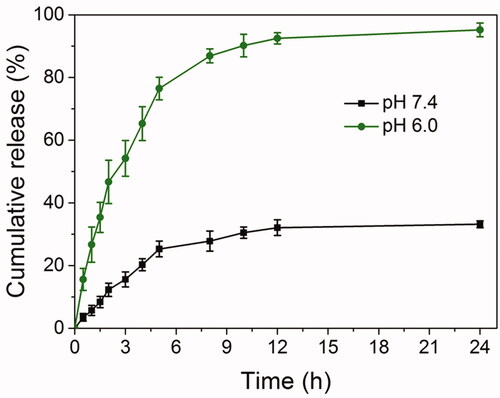
Figure 5. Therapeutic efficacy of Spe@HNPs for an acute lung infection. CFU of bacteria (A), leukocyte number (B), protein content (C), TNF-α (D), IL-1β (E), and IL-6 (F) in BALF of mice infected by MRSA BAA40 20 h after the treatments with PBS, HNPs, free drug or Spe@HNPs. The data are shown as mean ± s.d. (n = 5 independent experiments). P values: *p < .05, **p < .01, ***p < .001, N.S. (no significant difference) p > .05.
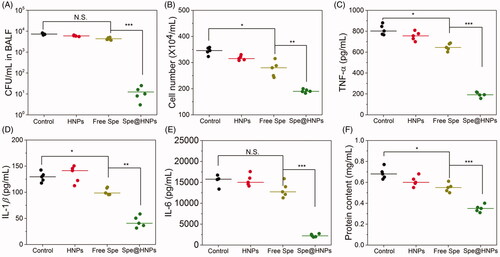
Table 2. Summary of MIC of samples against S. aureus and MRSA BAA40.