Figures & data
Table 1. Optimization variables and their responses used for Box–Behnken’s design software.
Table 2. Formation composition of apigenin bilosomes (APG-BLs) with actual and predicted value of the vesicle size (Y1) and entrapment efficiency (Y2).
Figure 1. 3D plots showing the influence of formulation variables. (A) Surfactant (Span-60, mg), (B) cholesterol (CHOR, %), (C) bile salt (mg), and (D) polyethylene glycol-2000 (mg) on the vesicle size.
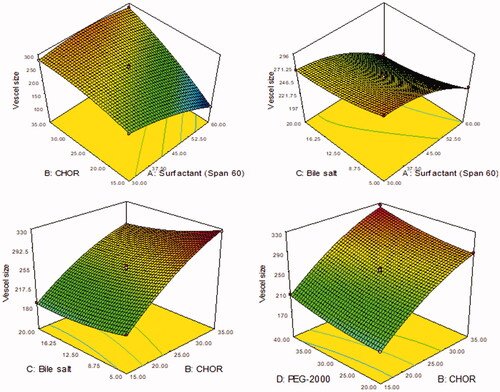
Figure 2. 3D plots showing the influence of formulation variables. (A) Surfactant (Span 60, mg), (B) cholesterol (CHOR, %), (C) bile salt (mg), and (D) polyethylene glycol-2000 (mg) on the entrapment efficiency (%).
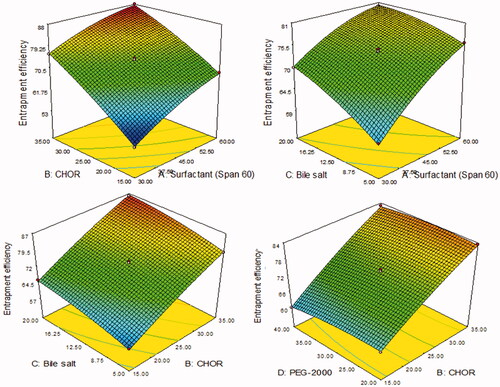
Figure 3. Actual and predicted plots of LL-PG-BLs showing the effect on vesicle size (nm) and entrapment efficiency (%).
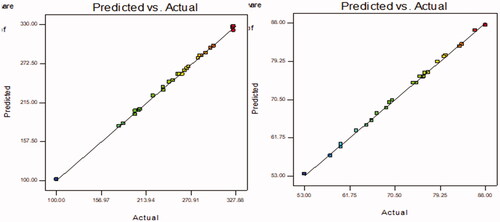
Table 3. Model statistical summary of all applied models for vesicle size and entrapment efficiency.
Table 4. ANOVA evaluation of best fitted quadratic model for vesicle size and entrapment efficiency.
Figure 4. Showing the (A) particle size distribution graph and (B) TEM image of the optimized LL-PG-BLs-opt.
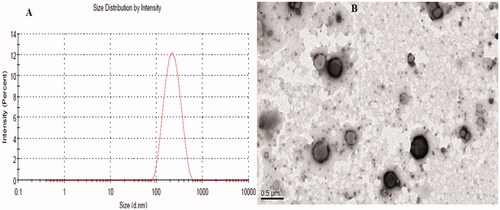
Figure 5. DSC curve: (A) pure luteolin, (B) bile salt, (C) polyethylene glycol 2000, (D) cholesterol, and (E) LL-PG-BLs-opt.
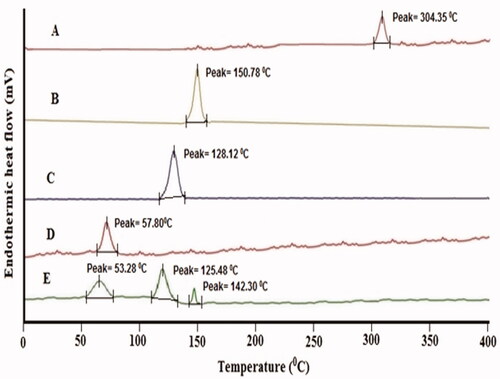
Figure 6. XRD-spectra: (A) pure luteolin, (B) cholesterol, (C) bile salt, (D) polyethylene glycol 2000, and (E) LL-PG-BLs-opt.
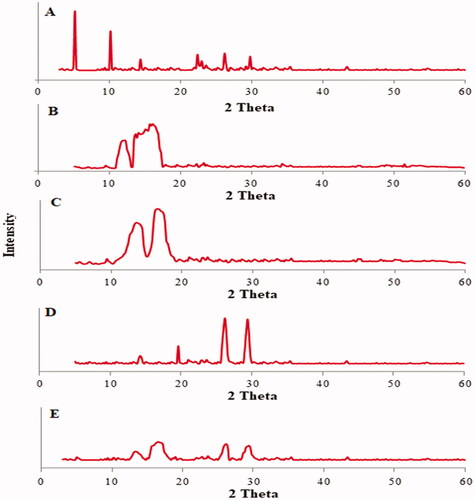
Figure 7. In vitro release profile of LL-dispersion, LL-BLs, and LL-PG-BLs-opt. Value represented as mean ± SD (n= 3).
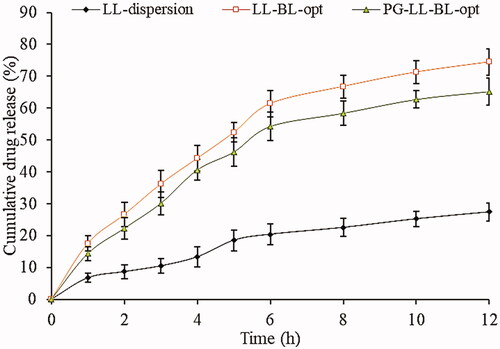
Figure 8. In vitro antioxidant activity of LL-dispersion, LL-BL-opt, and PG-LL-BL-opt. Data are the mean of three independent experiments and presented as mean ± SD, *significantly different from LL-dispersion (p<.05), #significantly different from LL-BL-opt (p<.05).
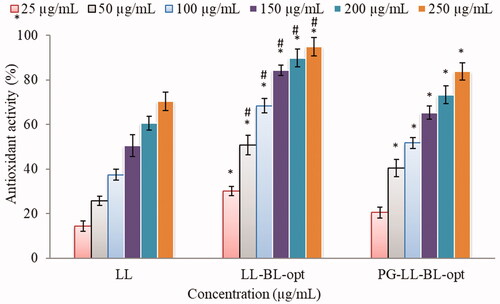
Figure 9. Cytotoxicity of LL incorporated in various formulations using MDA-MB-231 cell line at 24 h (A) and 48 h (B). Data shown are mean of three experiments and presented as mean ± SD. Tukey–Kramer’s multiple comparison test was used to evaluate the statistically significant difference between exposed different concentration and control. Difference was considered significant if p<.05. ***p<.001 when compared with control; **p<.001 when compared with the same concentration groups of pure LL.
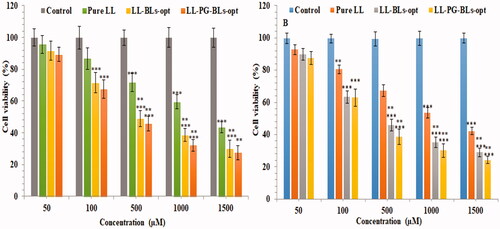
Figure 10. Cytotoxicity of LL incorporated in various formulation using MCF7 cell line at 24 h (A) and 48 h (B). Data shown are mean of three experiments and presented as mean ± SD. Tukey–Kramer’s multiple comparison test was used to evaluate the statistically significant difference between exposed different concentration and control. Difference was considered significant if p<.05. ***p<.001 when compared with control; **p<.001 when compared with the same concentration groups of pure LL.
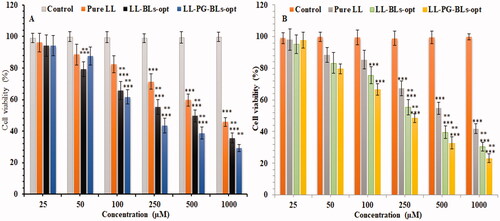
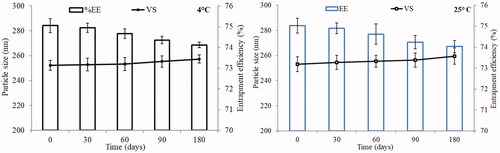
Figure 11. Stability study of optimized formulation (LL-PG-BL-opt) conducted at 4 °C and 25 °C. Experiment performed in triplicate and data shown as mean of three experiments (mean ± SD).