Figures & data
Table 1. Particle size and PDI of B-PNCs by DLS technique in different formulations.
Figure 1. Particle size distribution by intensity of ALEX-M-PNCs measured by DLS technique.
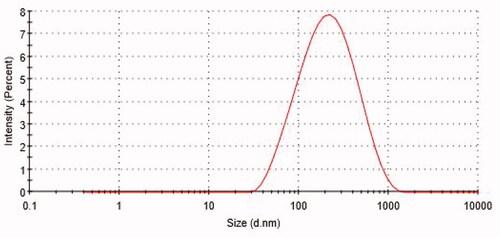
Figure 2. Zeta Potential distribution of ALEX-M-PNCs measured by DLS technique.
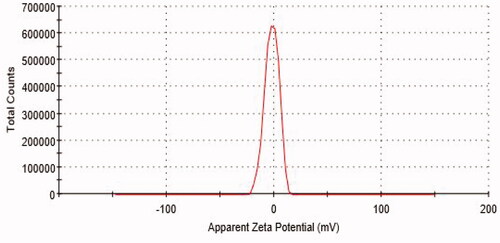
Figure 3. TEM images of ALEX-M-PNCs at different magnifications.
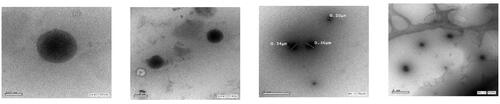
Figure 4. In-vitro release of ALEX-M from ALEX-M-PNCs in 48 hours.
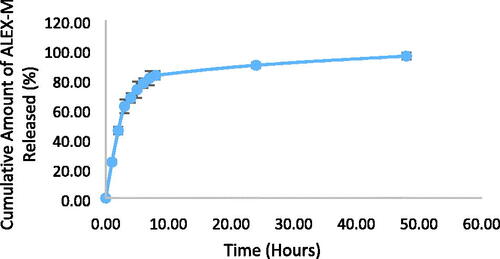
Figure 5. Thermogravimetry diagram of ALEX-M, ALEX-M-PNCs and B-PNCs.
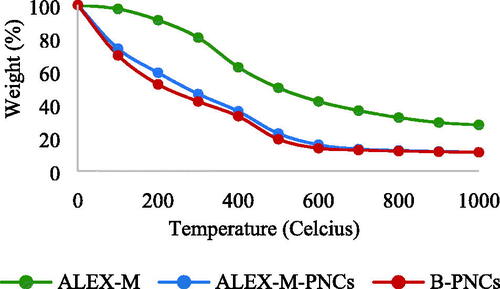
Figure 6. FTIR spectra of (a) ALEX-M, (b) ALEX-M-PNCs and (c) B-PNCs.
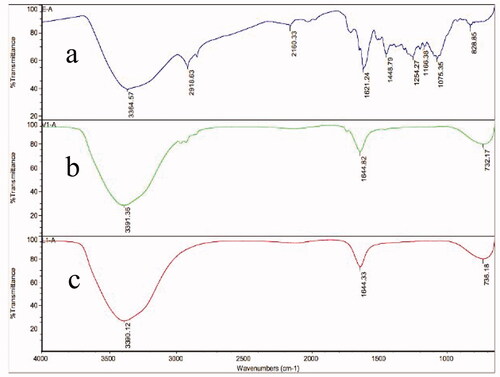
Figure 7. Concentration dependent cytotoxicity effect of LPS/INFγ, ALEX-M, ALEX-M-PNCs, B-PNCs, and Ibuprofen against RAW 264.7 cell line. Cell cytotoxicity was determined using MTT assay. Data are the means ± standard deviation (SD) of three independent experiments.
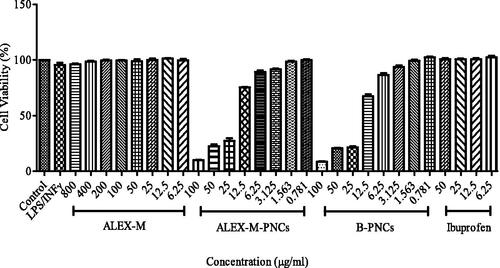
Figure 8. Effect of ALEX-M, ALEX-M-PNCs, and B-PNCS on LPS/IFNγ-induced NO in RAW 264.7 cells. Data are the means ± standard deviation (SD) of three independent experiments, p < 0.05. Student’s t test was used to compare EC50 values at p < 0.05.
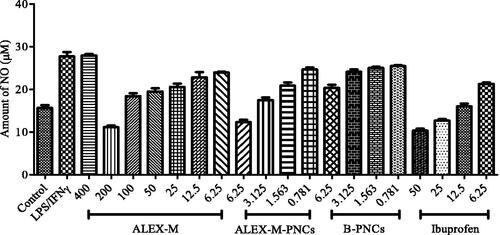
Figure 9. Signs of lethality in zebrafish embryos: (a) coagulation (b) non-detachment of tail (c) lack of somite formation (d) normal embryo showing no signs of toxicity at 24 hpf. Images were captured under magnification of 40×.
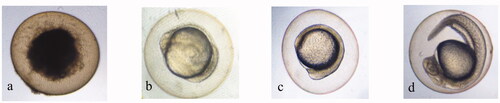
Figure 10. Dose response to mortality of zebrafish embryos at 96 hpf, exposed to ALEX-M (6.25–800 µg/ml) and ALEX-M-PNCs and B-PNCs at concentrations (6.25–100 µg/ml) (n = 12 embryos/group) of three independent replicates. Statistical analysis was performed using one-way ANOVA followed by Tukey’s post-hoc test. Different letters (a–d) indicate significant difference at p < 0.05.
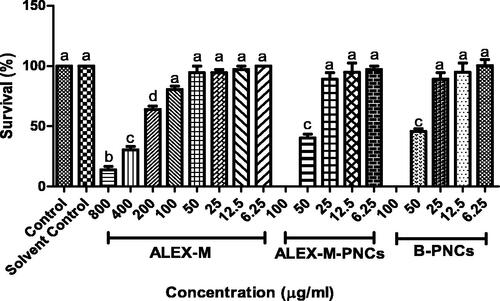
Figure 11. Effect of different concentrations of the tested samples on hatchability percentage in zebrafish embryo. Values are expressed as mean ± SD (n = 12 embryos/group) of three independent replicates. Statistical analysis was performed using one-way ANOVA followed by Tukey’s post-hoc test. Different letters (a–e) indicates significant difference at p < 0.05.
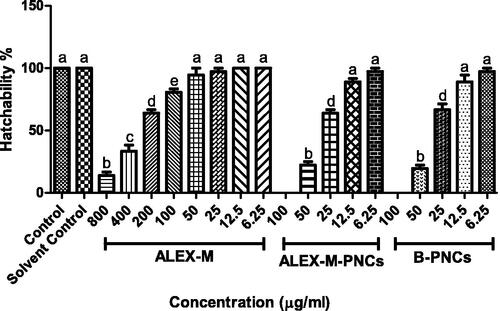
Figure 12. Effect of different concentrations of the tested samples on the heart rate in zebrafish embryo. Values are expressed as mean ± SD (n = 3 embryos/group) of three independent replicates. Statistical analysis was performed using one-way ANOVA followed by Tukey’s post-hoc test. Different letters (a–b) indicates significant difference at p < 0.05.
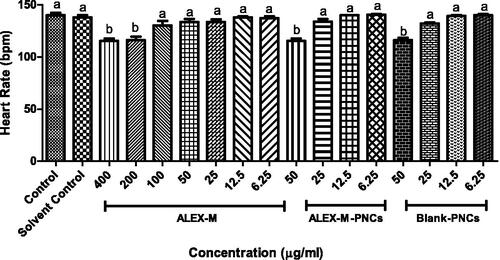
Figure 13. Malformations in zebrafish larva: (a) normal larva at 72 hpf, (b) spinal curvature, (c) scoliosis, (d) pericardial edema. Images were captured under magnification of 40×.
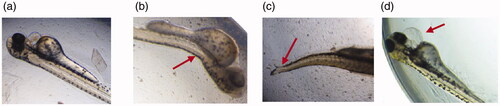
Figure 14. Dose response of embryonic zebrafish mortality at 96 hpf, exposed to ALEX-M (6.25–100 µg/ml) and ALEX-M-PNCs and B-PNCs at concentrations (0.625–2.5 µg/ml), (n = 12 embryos/group) in three replicates. Statistical analysis was performed using one-way ANOVA followed by Tukey’s post-hoc test. No significant difference occurred between all groups at p < 0.05.
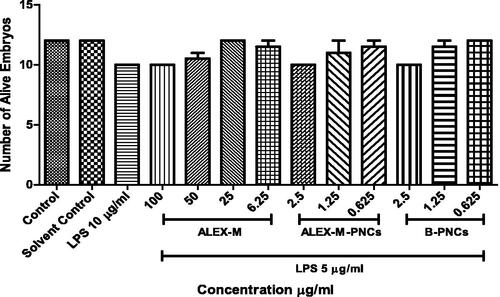
Figure 15. Fluorescence micrographs of LPS-stimulated NO generation in zebrafish embryos showing the effect of ALEX-M, ALEX-M-PNCs and B-PNCs on LPS-induced NO production. The images were visualized using 40× magnification power. (a) control, (b) ALEX-M 100 µg/ml, (c) LPS 5 µg/ml, (d1) ALEX-M 100 µg/ml + LPS 5 µg/ml, (d2) ALEX-M 50 µg/ml + LPS 5 µg/ml, (d3) ALEX-M 25 µg/ml + LPS 5 µg/ml, (d4) ALEX-M 6.25 µg/ml + LPS 5 µg/ml, (e1) ALEX_M_PNCs 2.5 µg/ml + LPS 5 µg/ml, (e2) ALEX_M_PNCs 1.25 µg/ml + LPS 5 µg/ml, (e3) ALEX_M_PNCs 0.625 µg/ml + LPS 5 µg/ml, (f1) B-PNCs 2.5 µg/ml + LPS 5 µg/ml, (f2) B-PNCs 1.25 µg/ml + LPS 5 µg/ml, (f3) B-PNCs 0.625 µg/ml + LPS 5 µg/ml.
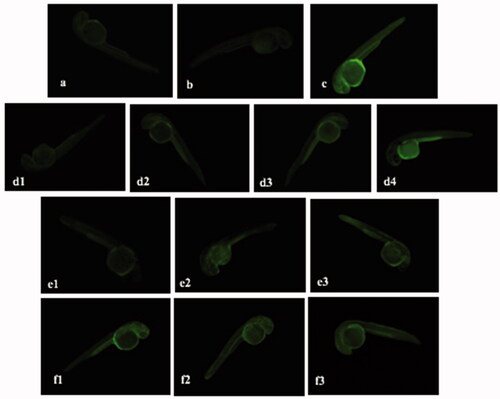
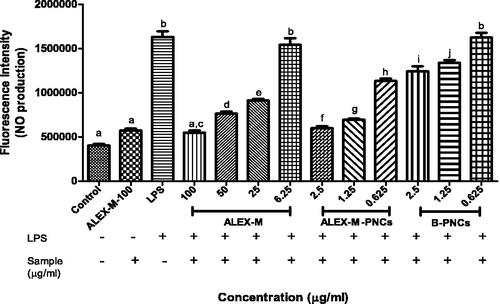
Figure 16. Quantitative analysis of fluorescence intensity of zebrafish embryos after staining with DAF-FM-DA using imageJ program. Data are represented as means ± SD from three independent experiments (n = 9 embryos/group). Statistical analysis was performed using one-way ANOVA followed by Tukey’s post-hoc test. Values with different letters (a–j) are significantly different in comparison to negative and positive control at p < 0.05.