
Figures & data
Scheme 1. p-DNA to l-DNA transformation. (a) PCR components and primer sequence design. (b) Diagram of the experimental procedure. (c) Agarose gel characterization of the synthesized l-DNA.
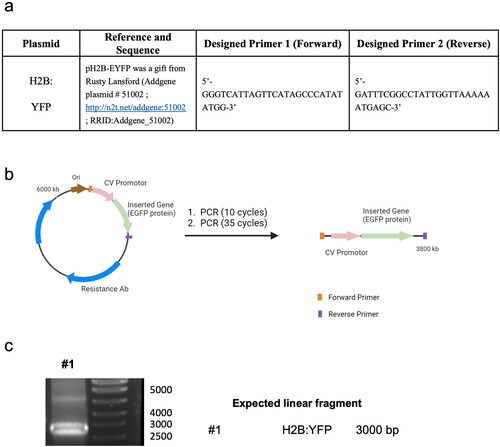
Table 1. Optimization of DNA@SiO2 particle synthesis.
Figure 1. p-DNA@SiO2 particles. (a) TEM images of p-DNA#4 particles with 4.5 µg of plasmid H2B:YFP DNA. (b) Particle diameter (mean ± SD) measured by TEM within a scatter dot plot comparing p-DNA#1-6 (n = 100). Values for p-DNA#5 and p-DNA#6 are not included due to the presence of aggregates (see Figures S8–S9). (*)(**) p-DNA#5-6 not included due to the presence of aggregates (see Figures S5–S6). (c) DLS characterization of p-DNA#1-6 bar chart of Z-size (mean ± SD, left Y axis, n = 3) and dot plot in red showing the polydispersity index (PDI) (mean ± SD, right Y axis, n = 3). (d) Flow cytometry quantification of the transfection efficiency (mean fluorescence intensity) of the p-DNA#4 DNA@SiO2 particles and a representative confocal microscopy image of HEK 293 cells expressing the recombinant H2B:YFP protein 72 h after transfection. Data are shown as the mean ± SD of 3 experimental replicas (n = 10,000 cells/replica, t-test, *p < 0.05, and ***p < 0.001).
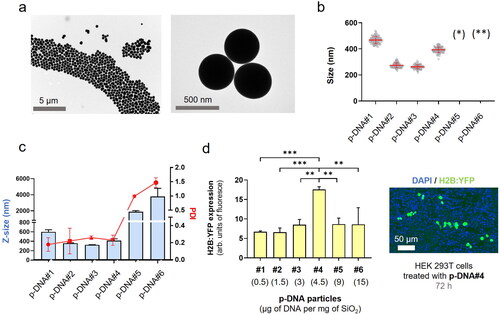
Figure 2. l-DNA@SiO2 particles. (a) TEM images of particles l-DNA#4 with 4.5 µg of linear H2B:YFP DNA. (b) Particle diameter (mean ± SD) measured by TEM within a scatter dot plot comparing l-DNA#1-5 (n = 100). (*) l-DNA#5 is not included due to the presence of aggregates (see Figure S11). (c) l-DNA#1-6 bar chart of Z-size (mean ± SD, left Y axis, n = 3) and dot plot in red showing polydispersity index (PDI) (mean ± SD, right Y axis, n = 3). (d) Flow cytometry quantification of the transfection efficiency (mean fluorescence intensity) of the l-DNA#4 DNA@SiO2 particles and a representative confocal microscopy image of HEK 293 cells expressing the recombinant H2B:YFP protein 72 h after transfection. Data are shown as the mean ± SD of 3 experimental replicas (n = 10,000 cells/replica, t-test, *p < 0.05, and ***p < 0.001).
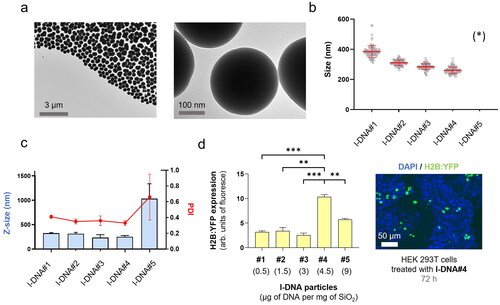
Figure 3. (a) Quantification of the transfection efficiency (mean fluorescence intensity) using p-DNA#4, l-DNA#2, and l-DNA#4 particles. Data are shown as the mean ± SD of 3 experimental replicas (n = 10,000 cells/replica, t-test, **p < 0.01, ***p < 0.001, and ****p < 0.0001). Protein expression profile from 24 h to 14 days. (b) Mechanistic proposal of differences in gene transfection efficiency for p-DNA#4, l-DNA#2, and l-DNA#4.
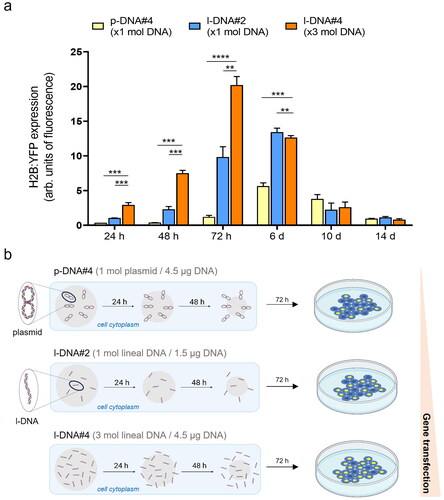
Figure 4. Effect of particle concentration on transfection efficiency and cell viability. (a) Flow cytometry quantification of transfected H2B:YFP protein by using l-DNA#4 particles (mean ± SD, n = 3) carrying different DNA@SiO2 concentrations (µg/ml IMDM). (b) MTT assay showing % of viable cells 24 h and 72 h after l-DNA#4 treatment with the same particles (mean ± SD, n = 6).
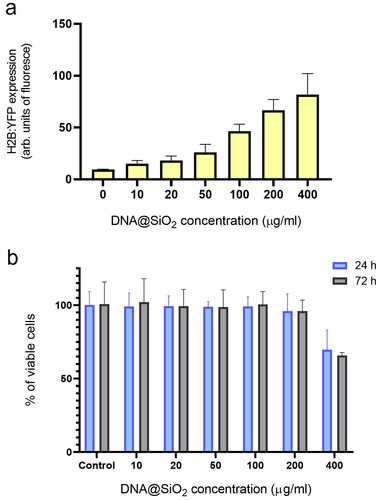
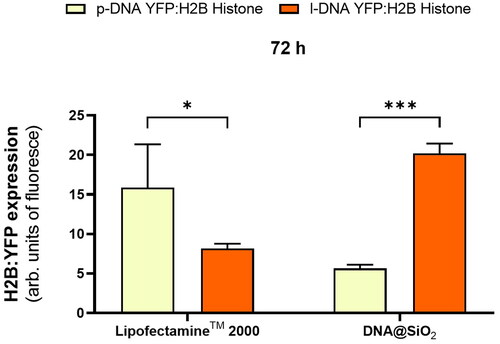
Figure 5. Quantification of H2B:YFP protein expression (mean fluorescence intensity) using LipofectamineTM 2000 and DNA@SiO2 system with p-DNA and l-DNA in HEK 293 cells. Data are shown as the mean ± SD of 3 experimental replicas (n = 10,000 cells/replica, t-test, *p < 0.05, and ***p < 0.001).
Supplemental Material
Download PDF (280.5 KB)Data availability statement
The data presented in this study are available on request from the corresponding author.