Figures & data
Figure 1 Microscopic view of a cross section of polysulfone hollow fiber membrane showing the inner thin layers and the spongy outside layer. (From Asahi Medical, Japan)
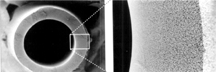
Figure 2 Changes in the enzyme activity with time for the adsorption of lipase on the polysulfone membrane at 40°C using lipase solution with an initial activity of 333 LU ml−1.
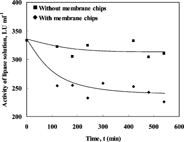
Figure 3 Amount of adsorbed enzyme on the polysulfone membrane at three constant temperatures, 30, 35 and 40°C, using lipase solution of 200 LU ml−1.
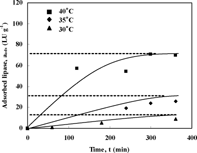
Figure 4 Comparison between experimental results and the proposed correlation for the amount of lipase adsorbed, aads, versus equilibrium free lipase concentration, afree. (▪, ♦, and ▴ are experimental results and – is the correlation curve at each temperature.)
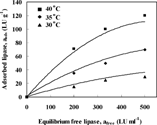
Table 1. Langmuir adsorption model parameters
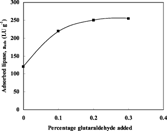
Figure 5 Effect of adding glutaraldehyde on the amount of lipase adsorbed at initial lipase activity of 500 LU ml−1 and 40°C.