563
Views
29
CrossRef citations to date
0
Altmetric
Original

Study on Small Gap Sleeve Bridging Peripheral Nerve Injury

, , , , &
Pages 55-74 | Published online: 11 Jul 2009

Figures & data

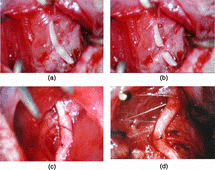
Figure 1 The artery conduit suture methods.

Figure 1 The artery conduit suture methods.

Figure 2 Section methods and site for artery conduit group.

Figure 2 Section methods and site for artery conduit group.

Figure 3 Artery conduit sleeve bridging.

Figure 3 Artery conduit sleeve bridging.

Figure 4 Outline of the artery conduit.

Figure 4 Outline of the artery conduit.

Figure 5 Motor nerve conduction velocity of 4 groups

Figure 5 Motor nerve conduction velocity of 4 groups

Figure 6 Myelinated fibers counting per unit vision field of every group

Figure 6 Myelinated fibers counting per unit vision field of every group

Figure 7 Distal myelinated fibres axons cross section area of different groups

Figure 7 Distal myelinated fibres axons cross section area of different groups

Figure 8 Regenerated nerve fibers grow through the conduit (2nd week, S100 immunohistochemistry staining).

Figure 8 Regenerated nerve fibers grow through the conduit (2nd week, S100 immunohistochemistry staining).

Figure 9 SMI-38 immunohistochemistry staining for the regenerated nerve axons of the distal segments (100 ×).

Figure 9 SMI-38 immunohistochemistry staining for the regenerated nerve axons of the distal segments (100 ×).

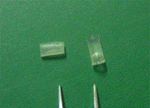
Figure 10 De-acetyl chitin conduit.

Figure 10 De-acetyl chitin conduit.

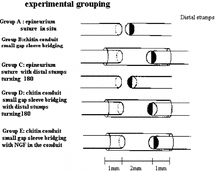
Figure 11 The different repair methods of every group.

Figure 11 The different repair methods of every group.

Figure 12 Conduit small gap bridging nerve model figure.

Figure 12 Conduit small gap bridging nerve model figure.

Figure 13 Section methods and site for conduit group.

Figure 13 Section methods and site for conduit group.

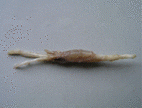
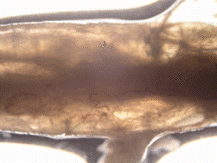
Figure 14 Outline of the chitin conduit 6 weeks after operation.

Figure 14 Outline of the chitin conduit 6 weeks after operation.

Figure 15 Motor nerve conduction velocity of 5 groups

Figure 15 Motor nerve conduction velocity of 5 groups

Figure 16 Myelinated fibers counting per unit vision field of every group

Figure 16 Myelinated fibers counting per unit vision field of every group

Figure 17 Distal myelinated fibers axons cross section area of different groups

Figure 17 Distal myelinated fibers axons cross section area of different groups

Figure 18 Regenerated nerve fibers in chitin conduit 4x.

Figure 18 Regenerated nerve fibers in chitin conduit 4x.

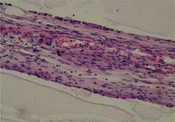
Figure 19 Regenerated nerve fibers grow through the conduit (4th week, HE staining, 40x).

Figure 19 Regenerated nerve fibers grow through the conduit (4th week, HE staining, 40x).

Reprints and Corporate Permissions

Please note: Selecting permissions does not provide access to the full text of the article, please see our help page How do I view content?

To request a reprint or corporate permissions for this article, please click on the relevant link below:

Academic Permissions

Please note: Selecting permissions does not provide access to the full text of the article, please see our help page How do I view content?

Obtain permissions instantly via Rightslink by clicking on the button below:

If you are unable to obtain permissions via Rightslink, please complete and submit this Permissions form. For more information, please visit our Permissions help page.