Figures & data
Figure 1 Scanning electron micrograph of sacrificial CaCO3 templates used for polypeptide capsule fabrication. Inset, enlarged view of a single particle. The sample was prepared by depositing a drop of aqueous particle suspension on a glass slide. Solvent was evaporated and particles were sputtered with a thin gold film. The Amray 1830 instrument (USA) was operated at an acceleration voltage of 20 keV.
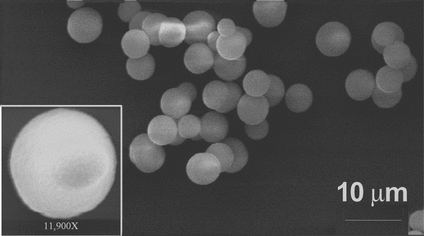
Figure 2 Adsorption capacity of GOx onto CaCO3 or MF particle templates as a function of the concentration of the enzyme and concentration of NaCl. The maximum adsorption onto colloidal CaCO3 was about 76 µg/mg particles.
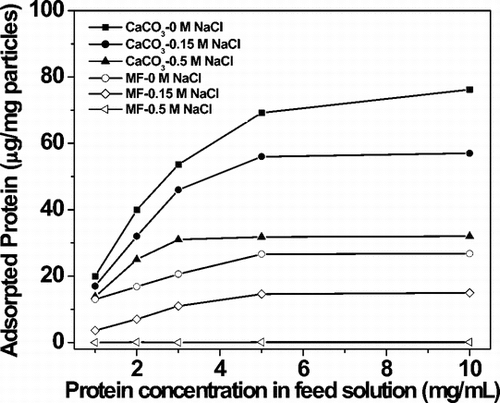
Figure 3 Loss of GOx during encapsulation within a polypeptide multilayer film. The polypeptide assembly solution contained 50% PEG (v/v). Inset, no PEG.
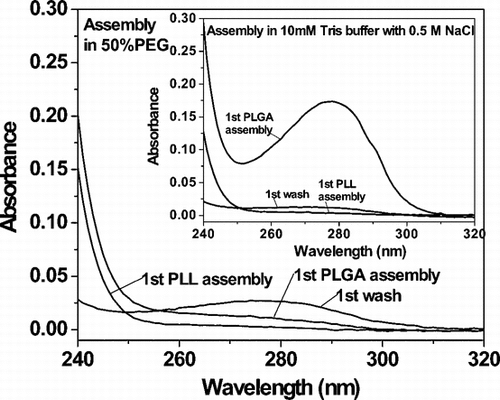
Figure 4 Activity of encapsulated enzyme as a function of the number of layers of polypeptide. Measurements are shown for microparticle cores before and after encapsulation, and with and without addition of PEG in the polypeptide assembly solutions. Capsules were not separated from EDTA prior to assay for enzyme activity. The right-most column shows the GOx activity in a sample of capsules following sonication.
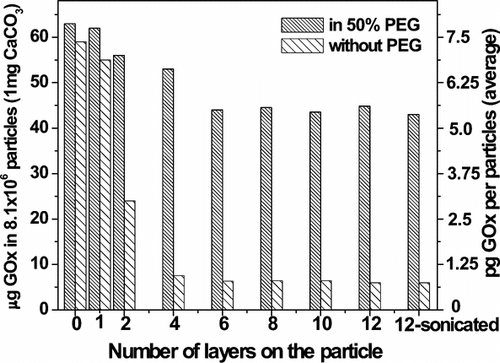
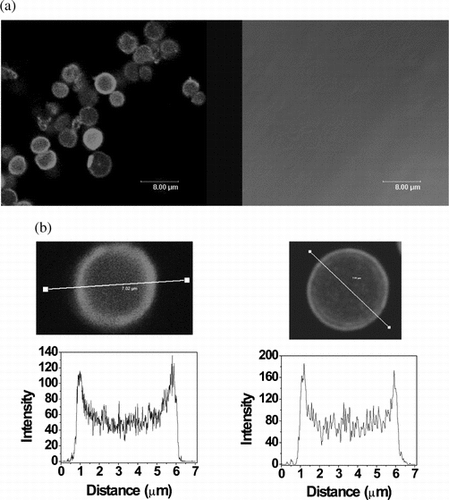
Figure 5 Visualization of GOx-Cy3-loaded polypeptide microcapsules. (a) Confocal microscopy image after dissolution of the template. Left, fluorescence; right, brightfield. (b) Fluorescence intensity profile of a capsule. Left, after dissolution of the core; right, coated core prior to dissolution of the template. Variations in fluorescence intensity of capsules reflect differences in distance between capsule and objective lens. The Leica instrument (Germany) was equipped with a 62 × oil immersion lens.
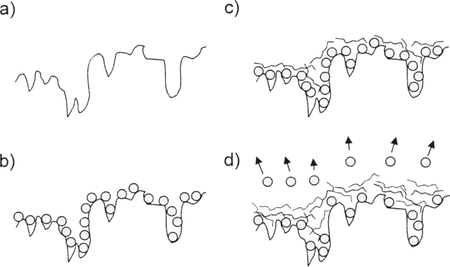
Supplementary Figure 1 Cartoon showing adsorption and desorption of GOx from the surface of a CaCO3 particle during microcapsule fabrication. a) The microparticle surface. b) Adsorbed GOx. c) Adsorbed PLL. d) Adsorption of PLGA results in loss of GOx, the latter being displaced by the former from the microparticle surface. The displacement process is driven by thermal fluctuations and mass action, and it involves the penetration of PLGA beneath the layer of PLL.
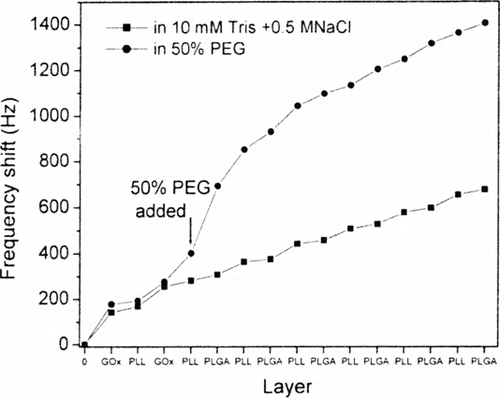
Supplementary Figure 2 Comparison of the assembly behavior of GOx/PLL/PLGA on a QCM resonator with and without addition of PEG in polypeptide assembly solutions. The experiment described here differs from the procedure used in capsule fabrication in that two bilayers of GOx/PLL were deposited before the first layer of PLL.
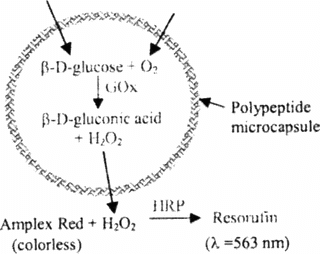
Supplementary Figure 3 Reaction scheme for photometric measurement of GOx activity in a polypeptide microcapsule. The microcapsule shell is shown in blue. Enzymes are shown in green type. β-D-glucose and molecular oxygen enter the capsule from outside, and hydrogen peroxide leaves the capsule. Reactants and products inside the microcapsule are shown in purple.
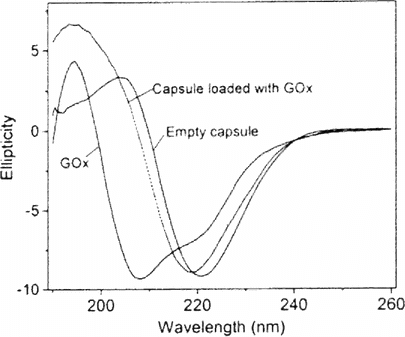
Supplementary Figure 4 Far-UV CD spectra of GOx alone and of polypeptide microcapsules with and without GOx. This is the first CD spectrum of a polypeptide microcapsule reported in the scientific literature.