Figures & data
Figure 1 Relative mass loss of sponges over time at pH 7.4 (in 0.1 M phosphate buffered saline) under infinite sink conditions at 37°C.
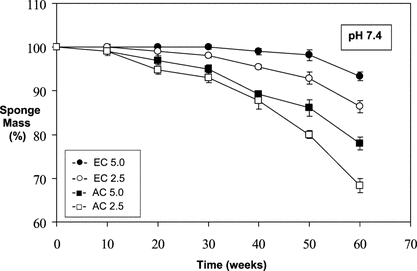
Figure 2 Relative mass loss of sponges over time at pH 6.0 (in 0.1 M acetate buffered saline) under infinite sink conditions at 37°C.
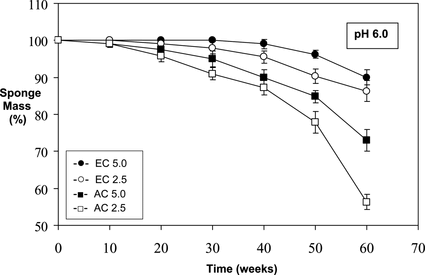
Figure 3 Relative mass loss of sponges over time at pH 5.0 (in 0.1 M acetate buffered saline) under infinite sink conditions at 37°C.
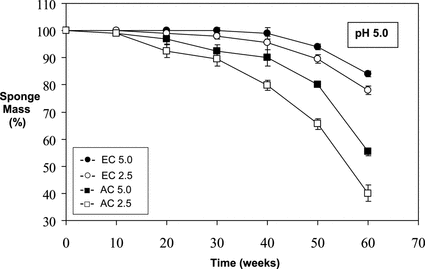
Table 1. Histomorphometric analysis on the in vivo degradation of AC and EC spongesFootnote[1]
Figure 4 Histological appearance of sponge implants retrieved: (A) after 10 weeks [AC5.0]; (B) after 10 weeks [AC2.5]; (C) after 30 weeks [AC2.5]; (D) higher magnification of C; (E) adjacent tissue at 60 weeks post-implantation [AC2.5]; (F) higher magnification of E; P: polymer, arrows: capillaries; FP: fat pad; H&E-stainings; scale bars = 100 µm.
![Figure 4 Histological appearance of sponge implants retrieved: (A) after 10 weeks [AC5.0]; (B) after 10 weeks [AC2.5]; (C) after 30 weeks [AC2.5]; (D) higher magnification of C; (E) adjacent tissue at 60 weeks post-implantation [AC2.5]; (F) higher magnification of E; P: polymer, arrows: capillaries; FP: fat pad; H&E-stainings; scale bars = 100 µm.](/cms/asset/3c61ad7d-b99f-4f9e-96f4-58aa8511d335/ianb19_a_176927_f0004_b.gif)
Figure 5 SEM images of sponge implants: (A) new prepared [AC5.0]; (B) new prepared [AC2.5]; (C) 10 weeks post-implantation [AC2.5]; (D) 30 weeks post-implantation [AC2.5]; (E) 60 weeks post-implantation [AC2.5].
![Figure 5 SEM images of sponge implants: (A) new prepared [AC5.0]; (B) new prepared [AC2.5]; (C) 10 weeks post-implantation [AC2.5]; (D) 30 weeks post-implantation [AC2.5]; (E) 60 weeks post-implantation [AC2.5].](/cms/asset/077eb4c8-e9c4-4ac8-89b0-cdbd486c0d23/ianb19_a_176927_f0005_b.gif)