Figures & data
Figure 1 Representative absorption spectrum of hemoglobin encapsulated in silica gel (solid line). The contributions of deoxy- (dashed line), oxy- (dash-dot line) and met-hemoglobin (dash-dot-dot line) spectra resulting from the linear fitting are reported. The calculated fractional saturation is 0.45 and the fractional met-hemoglobin content is 0.1.
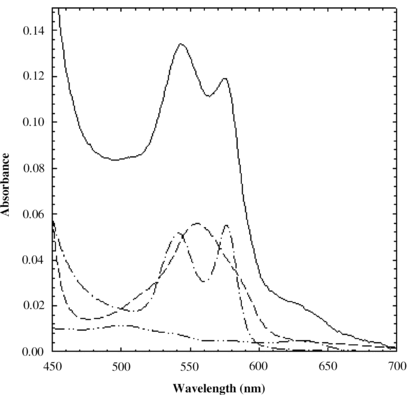
Figure 2 Hill plots of hemoglobin encapsulated in the absence of allosteric effectors (condition 1 in ) (open inverted triangles), in the presence of strong allosteric effectors (condition 5 in ) (open triangles), in the presence of a saturating concentration of chloride ions (condition 4 in ) (closed squares). For comparison, the Hill plot of hemoglobin in solution in the absence of allosteric effectors (condition 7 in ) (closed circles) is also reported. Solid lines through data points are the fit to the Hill equation.
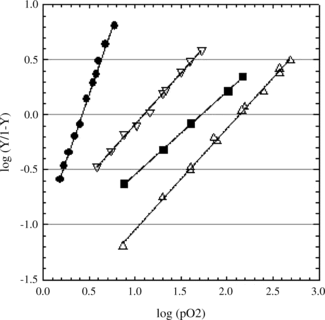
Figure 3 p50 values (white bars) and Hill coefficients (black bars) of hemoglobin encapsulated in silica gels prepared according to conditions 1–6 in .
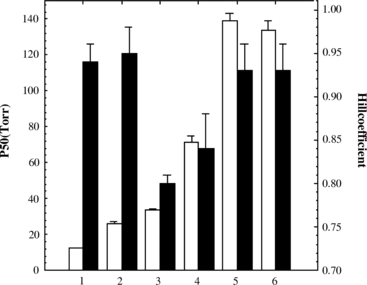
Table 1. Protocols, p50s and Hill coefficients of hemoglobin encapsulated in silica gel and in solution