Figures & data
Figure 1 Schematic flow-chart of the study.
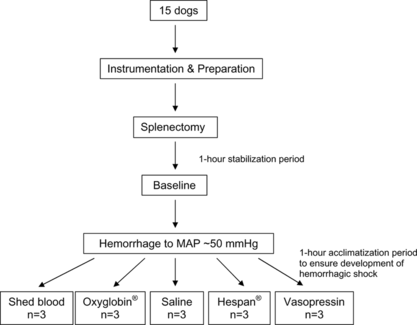
Figure 2 An overall view of the bioengineering station followed by a close-up view of the intravital microscope.
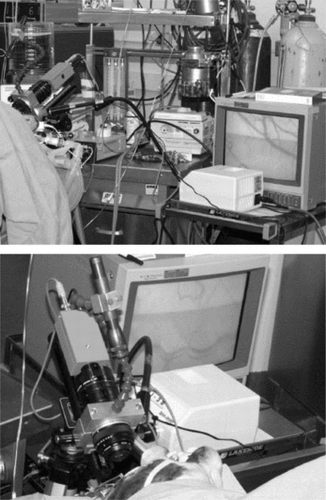
Figure 3 A series of three images showing the same location in the conjunctival microcirculation of a dog during pre-hemorrhagic (basline), post-hemorrhagic and post-resuscitation phases of the experiment in the autologous/shed blood study. Because of the unique shape and form of the vessels under observation, the vessels in the same location could be identified and relocated for longitudinal evaluations, using the baseline measurements of each vessel as control. Magnification = 125 × on-screen.
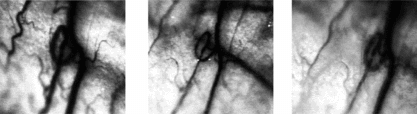
Figure 4 A series of three images showing the same location in the conjunctival microcirculation of a dog during pre-hemorrhagic (basline), post-hemorrhagic and post-resuscitation phases of the experiment in the crystalloid/saline study. Again, the same vessels were identified and relocated for longitudinal evaluations. Magnification = 125 × on-screen.
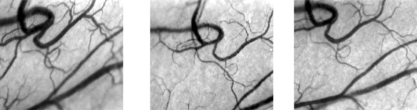
Figure 5 Post-hemorrhagic and post-resuscitation changes in venular diameters induced by the five resuscitation treatment modalities.
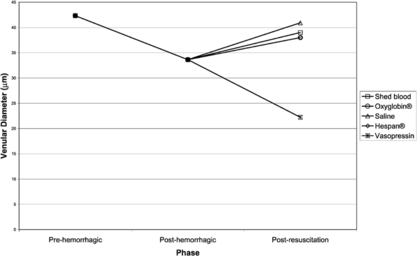
Figure 6 Post-hemorrhagic and post-resuscitation changes in red-cell velocity induced by the five resuscitation treatment modalities.
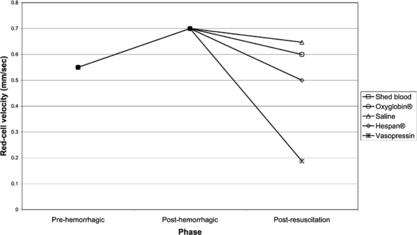
Figure 7 A series of two images showing the same location in the conjunctival microcirculation of a dog during post-hemorrhagic and post-resuscitation phases of the experiment in the vasopressin study. Again, the same vessels were identified and relocated for longitudinal evaluations. Note the extensive vasoconstriction arising from the vasopressin infusion. Magnification = 125 × on-screen.
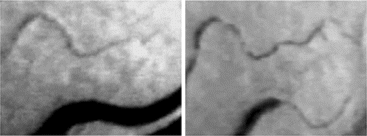
Figure 8 Post-hemorrhagic and post-resuscitation changes in arterial oxygen content (CaO2).
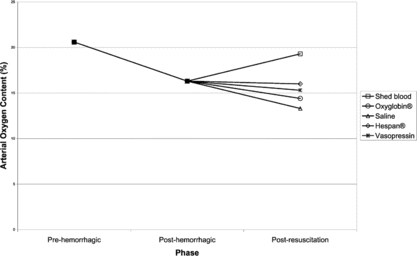
Figure 9 Post-hemorrhagic and post-resuscitation changes in venous oxygen content (CvO2).
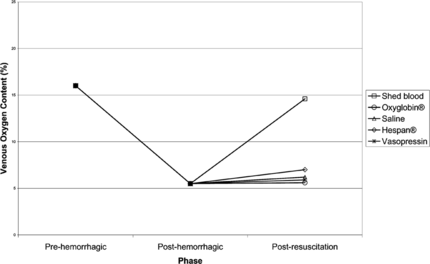
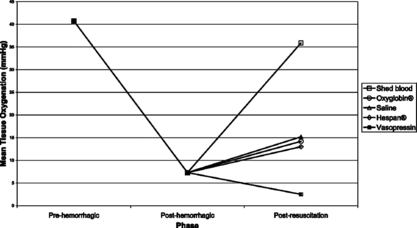
Figure 10 Post-hemorrhagic and post-resuscitation changes in mean tissue oxygenation (MtO2).