Figures & data
Table 1. Binding capacity of albumin isolated from blood plasma of uremic patients
Table 2. Protein-bound uremic toxins
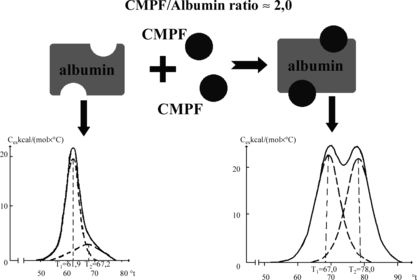
Figure 1 Melting thermograms of defatted HSA before (a) and after (b) loading with protein-bound uremic toxins. Dotted lines describe the results of this curve mathematical deconvolution onto elementary peaks.
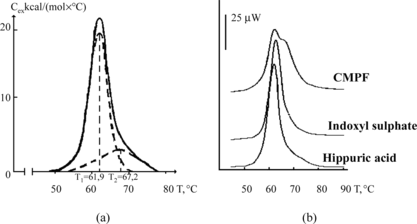
Table 3. Parameters of complex-formation for HSA with the 3 typical protein-bound uremic toxins
Table 4. Enthalpy of complex-forming abilities (kJ/M) of albumin preparations with marker ligands with respective affinity to binding centers of protein
Figure 3 Melting thermograms of albumin fraction isolated from blood plasma of uremic patients undergoing chronic alimentary hemodyalysis for 6 months–20 years.
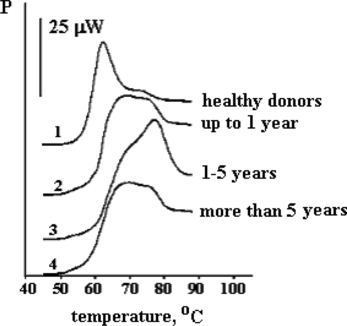
Table 5. Enthalpy of complex-formation of marker ligands (ΔHc, kJ/Mol) with albumin of healthy donors and uremic patients undergoing hemodialysis of different duration
Table 6. Enthalpy of complex formation (kJ/M) of albumin preparations with marker ligands for respective affine binding centers of protein
Figure 4 Demonstration of inefficacy of exhaustive dialysis and contact with SCN carbons of blood plasma of uremic patients for the removal of protein-bound toxins obtained by the methods of differential (a, b, c) and flow microcalorimetry (d).
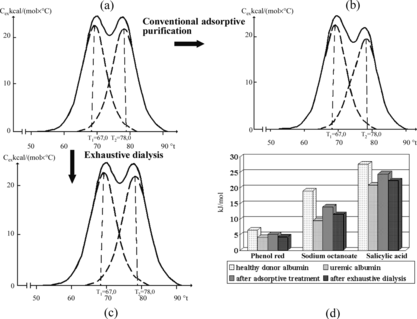
Table 7. Influence of adsorptive purification of uremic plasma at different pH on the value of enthalpy (kJ/M) of complex formation of uremic HSA with marker ligands
Figure 5 Melting thermograms of HSA isolated from uremic plasma before (a) and after adsorptive purification at pH = 7.2 and 3.0 (b and d), and after dilution with acetate buffer (pH = 5.08) with the next purification on carbonic adsorbent (c).
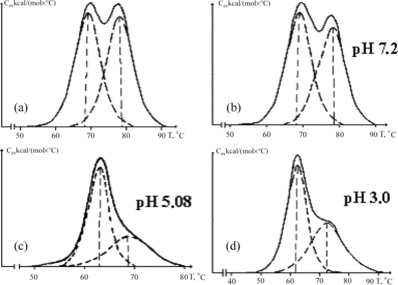
Table 8. Enthalpy of complex formation (kJ/M) of marker ligands with preparations of HSA isolated from uremic plasma treated by purification on the adsorbent at different pH values and acetate buffer dilution (ACB)
Figure 6 Principal scheme for the purification of blood plasma of uremic patients with the use of acetate buffer.
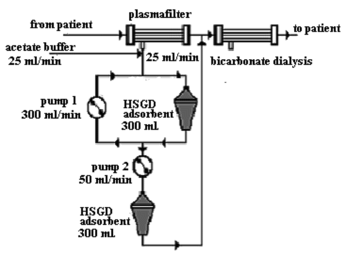
Table 9. Transformation of conventional phenolformaldehyde carbon (sample 1) into deliganding form (sample 2)
Table 10. Correlation between the degree of fractality of carbonic adsorbent (α) and adsorption of nonconjugated bilirubin (mg/g) from albumin-containing solution
Figure 7 Melting thermograms of CMPF-HSA complex before (1) and after (2) the contact with deliganding HSGD haemosorbent (a) and decrease of concentration of CMPF, indoxyl sulphate (IS) and hippuric acid (HA) after sorptional purification on HSGD carbons in microcolumn experiments (b).
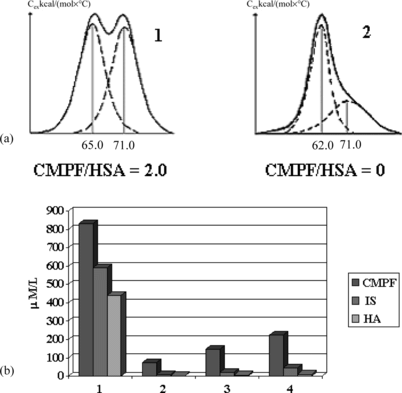
Figure 8 Melting curves and complex forming ability of HSA obtained from blood plasma of healthy donors and non-diabetic uremic patients preliminarily treated on HSGD haemosorbents.
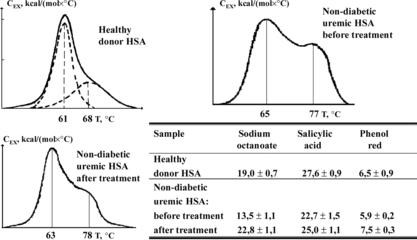
Figure 9 Principal scheme for the removal of protein-bound uremic toxins from blood of patients with renal insufficiency (from patient – pump 1 300 ml/min – pump 2, 30 ml/min – three-substituted citrate – deliganding adsorbent – to patient – dialysator).
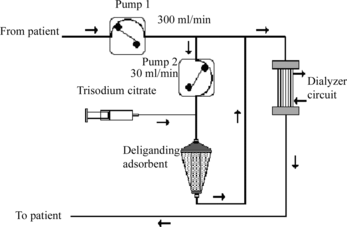
Table 11. HSGD carbons in the therapy of heavy forms of poisoning of children with death cap
