Figures & data
Figure 1 Covalent binding of enzyme on nitrocellulose membrane. (1) Nitrocellulose membrane. (2) Enzyme + Phenol red on nitrocellulose membrane. (3) Enzyme + Phenol red + Asparagine (10−1 M) → Purple Color.
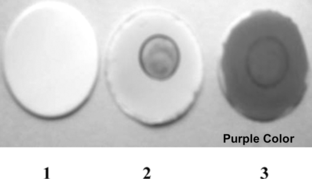
Figure 2 Detection of asparagine levels of 10−10–10−1 M (arranged in deceasing order of molar concentration in the figure) was not achieved on nitrocellulose membrane.
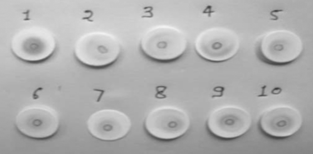
Table 1. The response time at various concentrations of asparagine solution on silicon gel plates
Figure 3 Immobilization of enzyme on silicon gel and reaction with varying concentration of asparagine (1) 10−1 M (2) 10−5 M (3) 10−10 M.
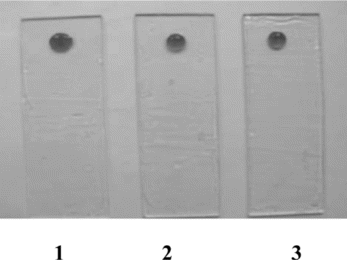
Table 2. The response time for color change of beads
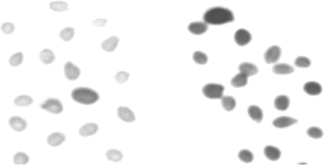
Figure 4 Color of beads before and after the reaction.