Figures & data
Figure 1 Apoptosis in total leukocytes and lymphocytes before and after HS and resuscitation. 1A. Apoptosis in total leukocyte population. Apoptosis data is presented as mean percentages of Annexin + /PI − cells±SEM within “total cells” gate. Neutrophils, monocytes and lymphocytes were included in the flow cytometry analysis. All groups exhibited an overtime increase of apoptosis, however, no group differences were observed. 1B. Apoptosis in lymphocyte population. Apoptosis data is presented as mean percentages of Annexin + /PI − cells±SEM within “lymphocytic cells” gate. All groups exhibited an overtime increase of apoptosis, however, no group differences were observed. Black bar − 31TD; grey bar − 2TD; open bar − 0.4 TD.
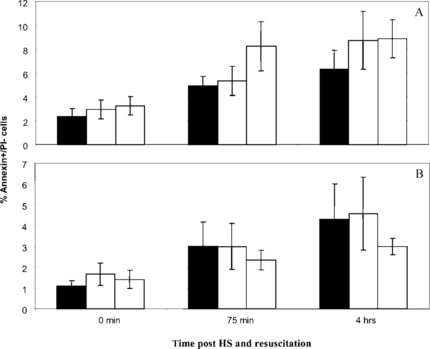
Table 1. Immune responses of 31 TD, 2 TD and 0.4 TD treatment groups before and after HS and resuscitation