Figures & data
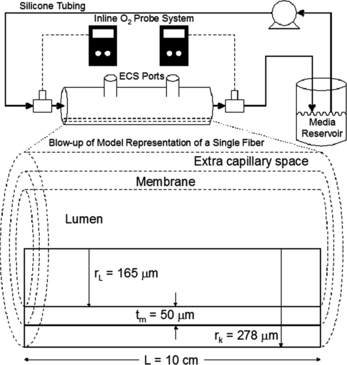
Figure 1 Schematic of the experimental hepatic hollow fiber bioreactor, along with a cross-sectional view of a single representative hollow fiber. Solid rectangles within the enlarged fiber represent the modeled space.

Table 1. Parameters of the hollow fiber bioreactor utilized in oxygen transport simulations
Figure 2 Comparison of experimentally measured oxygen consumption rates across the entire hollow fiber bioreactor along with values calculated by the oxygen transport model under identical conditions. ![]()
![Figure 2 Comparison of experimentally measured oxygen consumption rates across the entire hollow fiber bioreactor along with values calculated by the oxygen transport model under identical conditions. Display full size – Plain media, Display full size– RBC supplemented media, and Display full size– Oxygen transport simulations for both cases. Oxygen consumption rates were measured for the following sets of Q [mL/min] and inlet [mmHg]: A – 4.72/79, B – 8.35/85, C – 12.18/84, D – 4.72/77, E – 8.35/76, and F − 12.18/71.](/cms/asset/a51883f4-01b5-4c18-9801-c4d8bcf0d90d/ianb19_a_258479_f0002_b.gif)
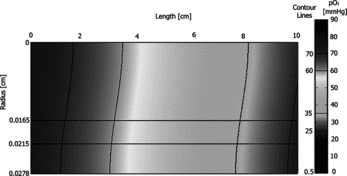
Figure 3 Oxygen concentration profile predicted by the oxygen transport model at one of the experimental conditions; umax = 0.18 cm/s, , and no RBC supplementation – case A from Figure 2.

Table 2. Clinically-relevant parameters of the hollow fiber bioreactor employed in oxygen transport simulations
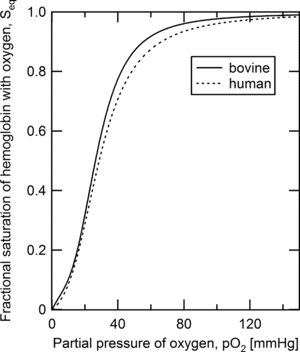
Figure 4 Oxygen-hemoglobin equilibrium binding curves for bovine and human red blood cells predicted from the Adair constants presented in Tables and .

Figure 5 Hepatic zonation of the ECS in each of the defined oxygenation zones for the predicted bioreactor operating conditions at an inlet dissolved oxygen tension of 90 mmHg at several flow rates: G&J – 4.72 [mL/min], H&K – 8.35 [mL/min], and I&L – 12.18 [mL/min], with either plain media circulating (G, H, & I) or circulating RBC supplemented media at 10% of the human in vivo RBC concentration (J, K, & L).
![Figure 5 Hepatic zonation of the ECS in each of the defined oxygenation zones for the predicted bioreactor operating conditions at an inlet dissolved oxygen tension of 90 mmHg at several flow rates: G&J – 4.72 [mL/min], H&K – 8.35 [mL/min], and I&L – 12.18 [mL/min], with either plain media circulating (G, H, & I) or circulating RBC supplemented media at 10% of the human in vivo RBC concentration (J, K, & L).](/cms/asset/ab1b2e27-cf65-4395-821d-77e04b6a353c/ianb19_a_258479_f0005_b.gif)
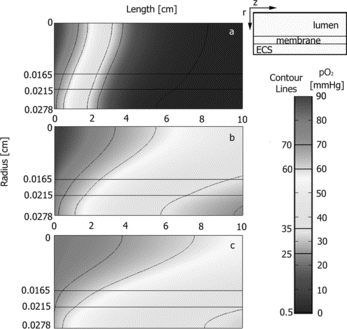
Figure 6 Oxygen concentration profiles predicted by the oxygen transport model at three predicted experimental conditions; umax = 0.465 cm/s and (a) 90mmHg with no RBC supplementation – case I from Figure 5, (b)
90mmHg with 10% supplementation of the human in vivo RBC concentration – case L from Figure 5, and (c)
with 20% supplementation of the human in vivo RBC concentration.
