841
Views
6
CrossRef citations to date
0
Altmetric
Original

Hypoxic Cell Death is Reduced by pH Buffering in a Model of Engineered Heart Tissue

, , , &
Pages 94-113 | Published online: 11 Jul 2009

Figures & data

TABLE 1 Composition and properties of serum-free media formulations used in experiments. ITS: insulin-transferrin-selenium supplement. Medium pH and osmolarity are expressed as the average ± standard deviation of three samples equilibrated for several hours in a 37 °C incubator with 5% CO2

Figure 1 Composite images of immunofluorescent staining for pimonidazole adducts, counterstained with DAPI. (A) NRVM monolayers cultured in a standard incubator, 400× mag; (B) NRVM monolayers cultured in 0% oxygen gas, 400× mag; periphery region of EHT gel shown at (C) 100× mag and (D) 200× mag. Bars represent pimonidazole staining front after 4 hrs, as measured from edge of section between EHTs formulated with 5 (low), 10 (medium), or 15× 106 cells/mL (high) initially (* p < 0.05 vs. other samples, n = 12).
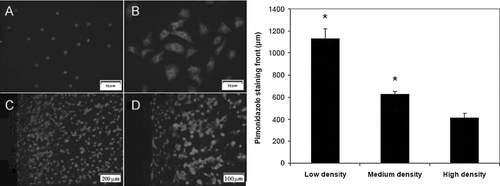
Figure 1 Composite images of immunofluorescent staining for pimonidazole adducts, counterstained with DAPI. (A) NRVM monolayers cultured in a standard incubator, 400× mag; (B) NRVM monolayers cultured in 0% oxygen gas, 400× mag; periphery region of EHT gel shown at (C) 100× mag and (D) 200× mag. Bars represent pimonidazole staining front after 4 hrs, as measured from edge of section between EHTs formulated with 5 (low), 10 (medium), or 15× 106 cells/mL (high) initially (* p < 0.05 vs. other samples, n = 12).

Figure 2 Acidosis is a function of oxygen concentration in NRVM monolayer cultures. Culture media pH was measured over time in NRVMs (n = 3) plated at medium density (5× 10⁴ cells/cm2) in 0%, 10%, and ambient air (20%) dry gas O2 fractions. Error bars represent mean ± standard deviation of three cell cultures for each condition.
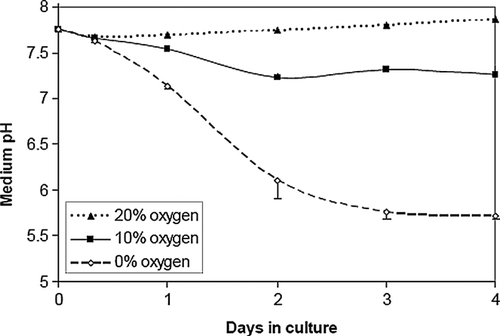
Figure 2 Acidosis is a function of oxygen concentration in NRVM monolayer cultures. Culture media pH was measured over time in NRVMs (n = 3) plated at medium density (5× 10⁴ cells/cm2) in 0%, 10%, and ambient air (20%) dry gas O2 fractions. Error bars represent mean ± standard deviation of three cell cultures for each condition.

Figure 3 Acidosis is a function of cell density in NRVM monolayers. Culture media pH was measured over time in NRVMs plated at 3 initial densities (3, 5 or 7 × 10⁴ cells/cm2) in 0% and ambient air (20%) dry gas oxygen fractions. Error bars represent mean ± standard deviation of three cell cultures for each condition.
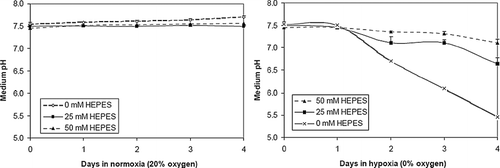
Figure 3 Acidosis is a function of cell density in NRVM monolayers. Culture media pH was measured over time in NRVMs plated at 3 initial densities (3, 5 or 7 × 10⁴ cells/cm2) in 0% and ambient air (20%) dry gas oxygen fractions. Error bars represent mean ± standard deviation of three cell cultures for each condition.

Figure 4 HEPES buffering reduces acidosis in NRVM monolayers. Culture media pH was measured over time in NRVM monolayers plated at low density (3 × 10 4 cells/cm2) and cultured in three different HEPES concentrations (0, 25, 50 mM) in 0% and ambient air (20%) dry gas oxygen fractions. Error bars represent mean ± standard deviation of three cell cultures for each condition.

Figure 4 HEPES buffering reduces acidosis in NRVM monolayers. Culture media pH was measured over time in NRVM monolayers plated at low density (3 × 10 4 cells/cm2) and cultured in three different HEPES concentrations (0, 25, 50 mM) in 0% and ambient air (20%) dry gas oxygen fractions. Error bars represent mean ± standard deviation of three cell cultures for each condition.

Figure 5 HEPES reduces propidium-iodide (PI) staining in hypoxic (0% oxygen) monolayer cultures. Cells were stained with the viability marker calcein-AM and the membrane-permeant death marker PI. Data shown is percent PI-positive cells in NRVM monolayers plated at low density (3 × 10⁴ cells/cm2) in 0% oxygen at three different HEPES concentrations: 0 mM (A), 25 mM (B), and 50 mM (C). Normoxic (20% oxygen) cultures with 0 mM HEPES (D) were used as a control. Error bars represent mean ± standard deviation of 6 measurements from 2 cell cultures for each condition (* p < 0.05 vs all other samples, † p < 0.10 vs. each other).
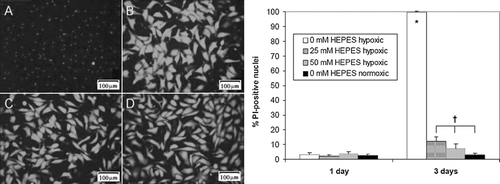
Figure 5 HEPES reduces propidium-iodide (PI) staining in hypoxic (0% oxygen) monolayer cultures. Cells were stained with the viability marker calcein-AM and the membrane-permeant death marker PI. Data shown is percent PI-positive cells in NRVM monolayers plated at low density (3 × 10⁴ cells/cm2) in 0% oxygen at three different HEPES concentrations: 0 mM (A), 25 mM (B), and 50 mM (C). Normoxic (20% oxygen) cultures with 0 mM HEPES (D) were used as a control. Error bars represent mean ± standard deviation of 6 measurements from 2 cell cultures for each condition (* p < 0.05 vs all other samples, † p < 0.10 vs. each other).

Figure 6 HEPES reduces TUNEL staining in hypoxic (0%) monolayer cultures. Data shown is percent TUNEL-positive cells in NRVM monolayers plated at low density (3 × 10⁴ cells/cm2) in 0% oxygen at three different HEPES concentrations: 0 mM (A), 25 mM (B), and 50 mM (C). Normoxic (20% oxygen) cultures with 0 mM HEPES (D) were used as a positive control. Error bars represent mean ± standard deviation of 6 measurements from 2 cell cultures for each condition (* p < 0.05 vs. all other samples).
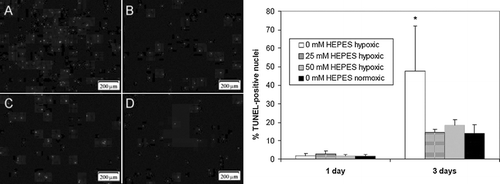
Figure 6 HEPES reduces TUNEL staining in hypoxic (0%) monolayer cultures. Data shown is percent TUNEL-positive cells in NRVM monolayers plated at low density (3 × 10⁴ cells/cm2) in 0% oxygen at three different HEPES concentrations: 0 mM (A), 25 mM (B), and 50 mM (C). Normoxic (20% oxygen) cultures with 0 mM HEPES (D) were used as a positive control. Error bars represent mean ± standard deviation of 6 measurements from 2 cell cultures for each condition (* p < 0.05 vs. all other samples).

Figure 7 Radial pH gradients in EHTs cultured in media containing three different concentrations of HEPES after 4 hrs: 50 mM (A), 25 mM (B), and 0 mM (C). Images of EHTs were captured with a digital camera and analyzed with image analysis software to generate phenol red coloration gradients. Phenol red color was calibrated to known pH values with cell-free gels equilibrated in acidified media (see methods).
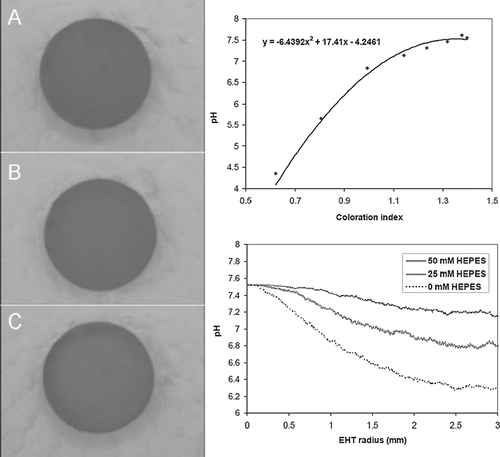
Figure 7 Radial pH gradients in EHTs cultured in media containing three different concentrations of HEPES after 4 hrs: 50 mM (A), 25 mM (B), and 0 mM (C). Images of EHTs were captured with a digital camera and analyzed with image analysis software to generate phenol red coloration gradients. Phenol red color was calibrated to known pH values with cell-free gels equilibrated in acidified media (see methods).

Figure 8 HEPES increases calcein staining in EHTs. Images shown are calcein-positive cells in the edge region of EHTs cultured in three different concentrations of HEPES: 0 mM after 4 hrs (A); 0 mM at 36 hrs (B), 25 mM at 36 hrs (C), and 50 mM at 36 hrs (D). Graph shows histogram of calcein-positive cell density in EHTs after 36 hrs.
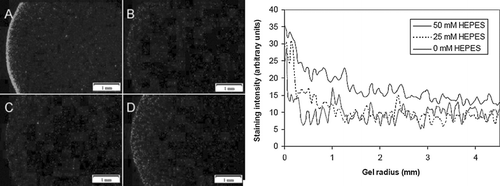
Figure 8 HEPES increases calcein staining in EHTs. Images shown are calcein-positive cells in the edge region of EHTs cultured in three different concentrations of HEPES: 0 mM after 4 hrs (A); 0 mM at 36 hrs (B), 25 mM at 36 hrs (C), and 50 mM at 36 hrs (D). Graph shows histogram of calcein-positive cell density in EHTs after 36 hrs.

Figure 9 HEPES reduces lactate dehydrogenase (LDH) release from EHTs. EHTs were cultured in three different concentration of HEPES over 36 hrs and culture media assayed for LDH. Data is expressed as a fraction of LDH from a lysate of the original number of entrapped cells. Error bars represents mean ± standard deviation of 3 measurements for each time point.
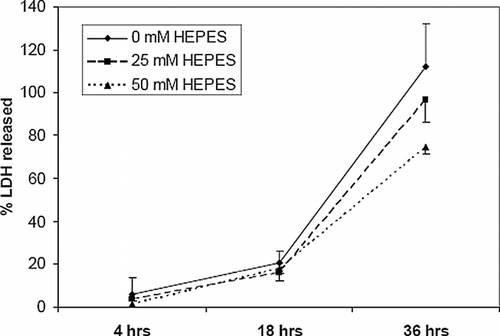
Figure 9 HEPES reduces lactate dehydrogenase (LDH) release from EHTs. EHTs were cultured in three different concentration of HEPES over 36 hrs and culture media assayed for LDH. Data is expressed as a fraction of LDH from a lysate of the original number of entrapped cells. Error bars represents mean ± standard deviation of 3 measurements for each time point.

Reprints and Corporate Permissions

Please note: Selecting permissions does not provide access to the full text of the article, please see our help page How do I view content?

To request a reprint or corporate permissions for this article, please click on the relevant link below:

Academic Permissions

Please note: Selecting permissions does not provide access to the full text of the article, please see our help page How do I view content?

Obtain permissions instantly via Rightslink by clicking on the button below:

If you are unable to obtain permissions via Rightslink, please complete and submit this Permissions form. For more information, please visit our Permissions help page.