933
Views
37
CrossRef citations to date
0
Altmetric
Original

Engineering of Rat Articular Cartilage on Porous Sponges: Effects of TGF-β 1 and Microgravity Bioreactor Culture

, , , &
Pages 123-137 | Published online: 11 Jul 2009

Figures & data

TABLE 1 The experimental groups

Figure 1 Schematic presentation of the experimental procedures.

Figure 1 Schematic presentation of the experimental procedures.

TABLE 2 Effect of seeding technique on cell loading capacity of PLGA sponge

Figure 2 Representative SEM images of the macroporous PLGA sponges seeded with rat articular chondrocytes retrieved from (A) static, (B) bioreactor cultures after 28 days with TGF-β 1-induction. Infiltration of chondrocytes into sponge pores (C) and outer surface (D) can be visualized in high magnification images of B. Note the decreasing sponge pore size in bioreactor culture (B) compared to the static culture (A). Scale bars, A and B: 100 μ m; C and D: 10 μ m.
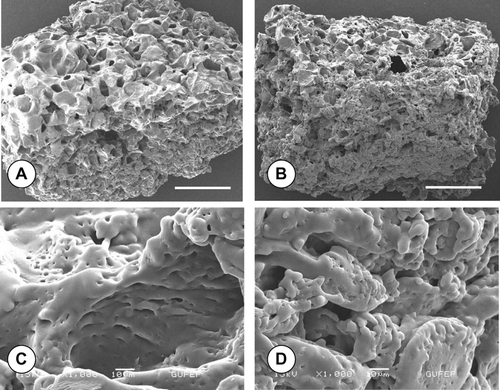
Figure 2 Representative SEM images of the macroporous PLGA sponges seeded with rat articular chondrocytes retrieved from (A) static, (B) bioreactor cultures after 28 days with TGF-β 1-induction. Infiltration of chondrocytes into sponge pores (C) and outer surface (D) can be visualized in high magnification images of B. Note the decreasing sponge pore size in bioreactor culture (B) compared to the static culture (A). Scale bars, A and B: 100 μ m; C and D: 10 μ m.

Figure 3 Change in the number of chondrocytes cultured on 35 mm-tissue culture dishes (2D-static), and inside sponges (3D-static and 3D-dynamic) under (A) standard, (B) TGF-β 1-induced culture conditions. Cell numbers at Day 0 were: ∼ 25.000 cells/dish and ∼ 50.000 cells/sponge. Absorbance values are presented as normalized means± SD from three independent experiments. (Continued)
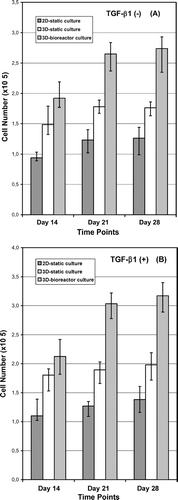
Figure 3 Change in the number of chondrocytes cultured on 35 mm-tissue culture dishes (2D-static), and inside sponges (3D-static and 3D-dynamic) under (A) standard, (B) TGF-β 1-induced culture conditions. Cell numbers at Day 0 were: ∼ 25.000 cells/dish and ∼ 50.000 cells/sponge. Absorbance values are presented as normalized means± SD from three independent experiments. (Continued)

Figure 4 Phase-contrast micrographs demonstrating the dark blue formazan crystals formed from MTT inside sponge pores after 14 days of dynamic culture: in (A) standard, (B) TGF-β 1-containing medium; scale bars: 200 μ m. Note the round-shaped chondrocytes (arrows) at the vicinity of the formazan crystals.
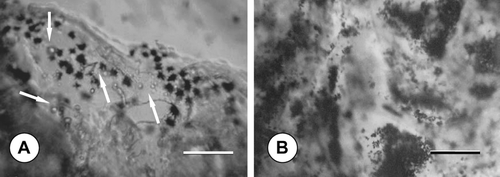
Figure 4 Phase-contrast micrographs demonstrating the dark blue formazan crystals formed from MTT inside sponge pores after 14 days of dynamic culture: in (A) standard, (B) TGF-β 1-containing medium; scale bars: 200 μ m. Note the round-shaped chondrocytes (arrows) at the vicinity of the formazan crystals.

Figure 5 Light microscopy images demonstrating proteoglycan stainings. Alcian blue (A, B) and Safranin-O (C, D) stainings of rat articular chondrocytes on PLGA sponge under static (A and C) and bioreactor (B and D) culture conditions with TGF-β 1 at Day 28; scale bars: 200 μ m. Note the strong stainings of the samples retrieved from bioreactor cultures confirming the chondrogenic state.
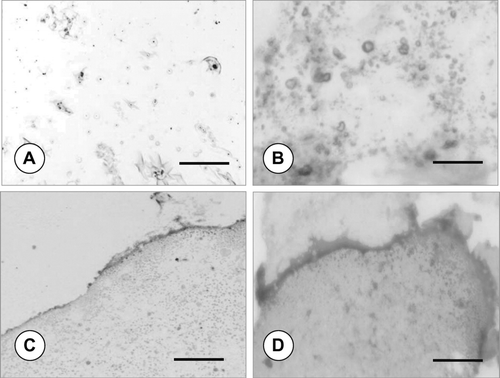
Figure 5 Light microscopy images demonstrating proteoglycan stainings. Alcian blue (A, B) and Safranin-O (C, D) stainings of rat articular chondrocytes on PLGA sponge under static (A and C) and bioreactor (B and D) culture conditions with TGF-β 1 at Day 28; scale bars: 200 μ m. Note the strong stainings of the samples retrieved from bioreactor cultures confirming the chondrogenic state.

Figure 6 Light microscopy images demonstrating immunohistochemical stainings. Anti-rat Collagen type II (A, B) and Anti-rat Aggrecan (C, D) stainings of rat articular chondrocytes on PLGA sponge under static (A and C) and bioreactor (B and D) culture conditions with TGF-β 1 at Day 28; scale bars: 200 μ m.
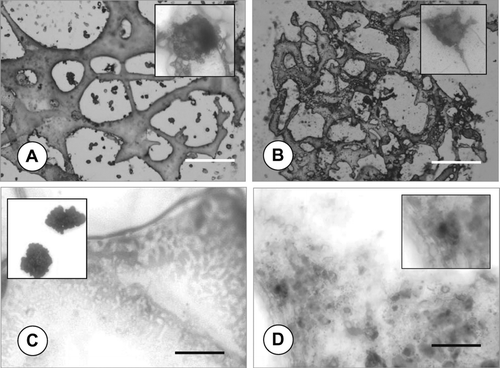
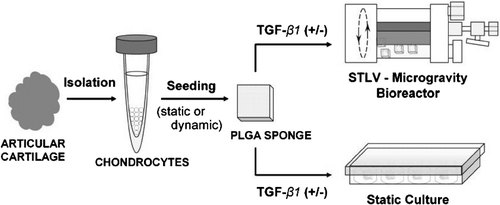
Figure 6 Light microscopy images demonstrating immunohistochemical stainings. Anti-rat Collagen type II (A, B) and Anti-rat Aggrecan (C, D) stainings of rat articular chondrocytes on PLGA sponge under static (A and C) and bioreactor (B and D) culture conditions with TGF-β 1 at Day 28; scale bars: 200 μ m.

Reprints and Corporate Permissions

Please note: Selecting permissions does not provide access to the full text of the article, please see our help page How do I view content?

To request a reprint or corporate permissions for this article, please click on the relevant link below:

Academic Permissions

Please note: Selecting permissions does not provide access to the full text of the article, please see our help page How do I view content?

Obtain permissions instantly via Rightslink by clicking on the button below:

If you are unable to obtain permissions via Rightslink, please complete and submit this Permissions form. For more information, please visit our Permissions help page.