Figures & data
Figure 1. The schematics of the experimental protocol. After 30 minutes of baseline, hearts were arrested with and stored in STS without (STS group) and with 5 gHb/dL PolyPHb (PolyPHB group) at 4°C for 8 hours, then reperfused with KHB for 2 hours. STS: St. Thomas’ solution, KHB: Krebs-Henseleit buffer.
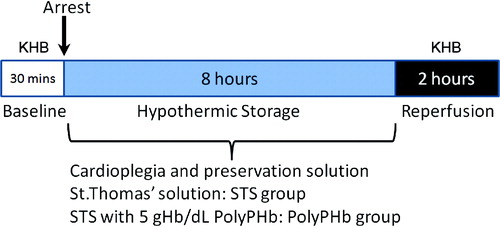
Figure 2. The recovery of HR (a), LVDP (b), ±dp/dt (c and d), and CF (e) during 2-hour reperfusion. Values were presented as mean±SEM (n = 8 to 9). **P < 0.01 vs STS group. HR: heart rate, LVDP: left ventricular development pressure, ±dp/dt: maximum LVDP increase and decrease rate, CF: coronary flow rate.
Figure 3. The total CK and LDH release of 2 group hearts after 2-hour reperfusion. Values were expressed as mean±SEM (n = 8 to 9). *P < 0.05 vs STS group. CK: creatine kinase, LDH: lactate dehydrogenase.
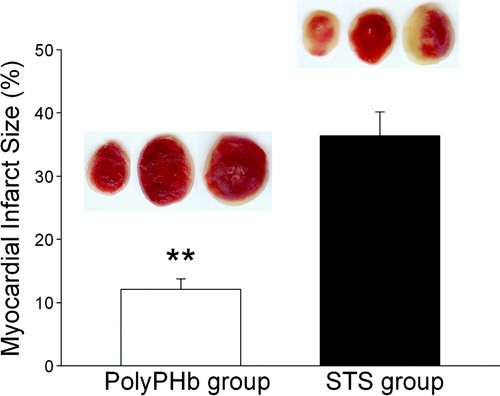
Figure 4. Myocardial infarct size determined by TTC staining. Red staining areas indicate viable tissue and non-stained pale areas indicate infarct tissue. Representative TTC-stained myocardial sections were shown at the top. Values were presented as mean±SEM (n = 5, 5 to 6 slices per heart). **P < 0.01 vs STS group.