Figures & data
Table 1. Parameters of beads and solutions used in the total volume ratio experiments
Figure 1. Fitted curves comparing heparin absorption rates under conditions where ratio of bead to solution volume is kept constant.
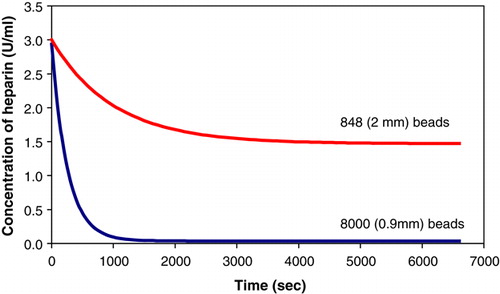
Table 2. Parameters of beads and solutions used in the surface area ratio experiments.
Figure 2. Fitted curves comparing heparin absorption rates under conditions where the ratio of the total surface area of the beads to the volume of the solution is kept constant.
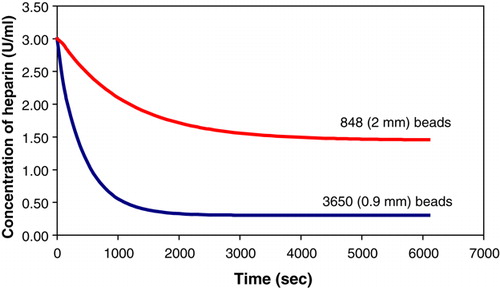
Figure 3. Comparison of the adsorption of heparin by beads with varying concentrations of sodium alginate. The two curves are not easily distinguishable due to being superimposed.
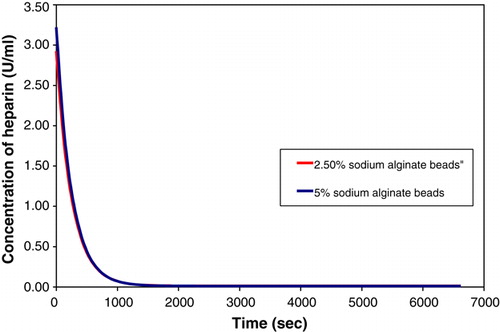
Figure 4. Adsorption of heparin by beads with no membrane.
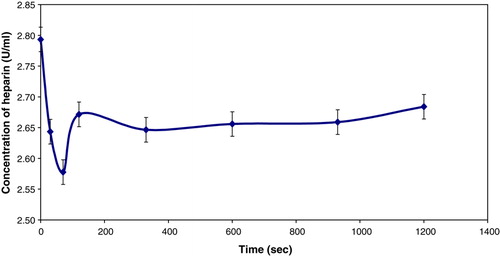
Figure 5. Microscopic photograph of the 900 µm and 2 mm beads illustrating the different membrane thickness.
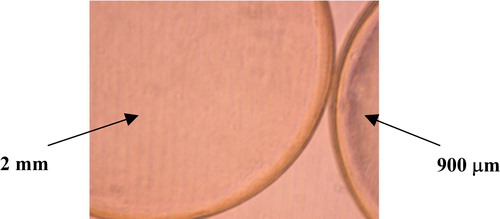
Table 3. Parameters used in the bead membrane volume ratio experiments.
Figure 6. Comparison of heparin absorption rate under conditions where the ratio of the membrane volume of the beads remains constant.
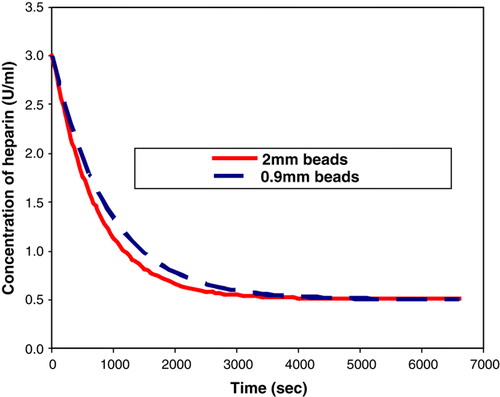
Figure 7. K-values for various membrane volumes of the beads.
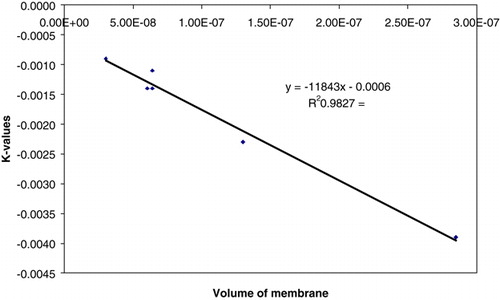
Figure 8. Data points fitted to Freundlich Isotherm using the volume of membrane of the beads.
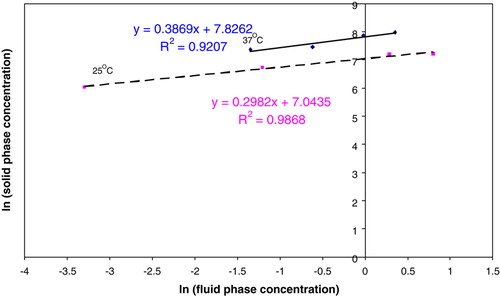
Figure 9. Microscopic photograph of 2 mm beads placed in poly-L-lysine solution for 20 minutes and 40 minutes, respectively.
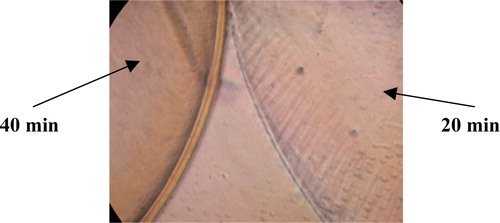
Figure 10. Microscopic photograph of 2 mm beads placed in poly-L-lysine solution for 20 minutes and 60 minutes, respectively.
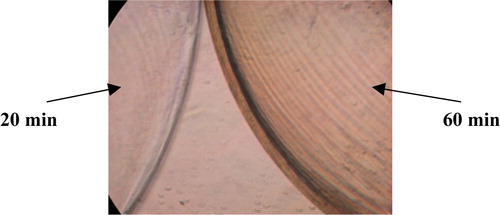
Figure 11. Rates of heparin removal using beads with varying poly-L-lysine content.
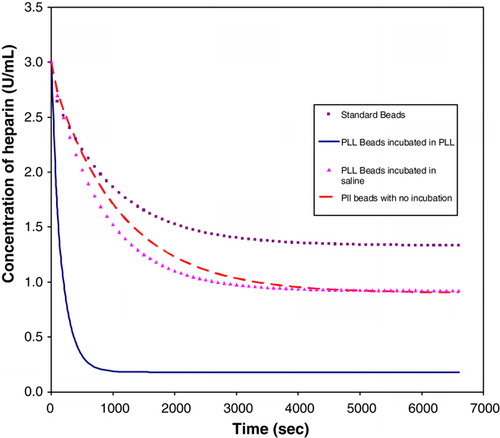
Table 4. Rate coefficients for the beads with varying poly-L-lysine (PLL) content
Figure 12. Comparison of the rate of heparin adsorption in fetal calf serum (FCS) and saline.
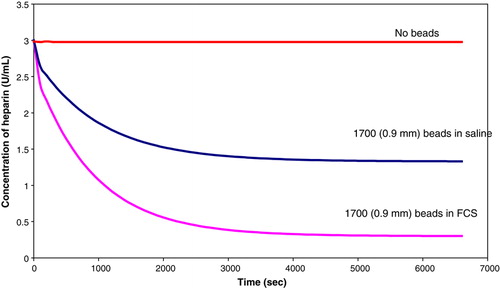
Figure 13. Comparison of the rate of heparin adsorption in blood, fetal calf serum and saline.
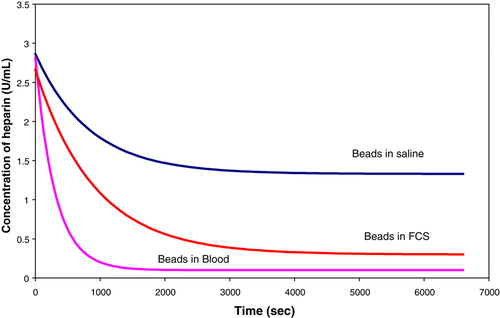
Table 5. Rate coefficients for blood, FCS and saline
Figure 14. Comparison of the rate of heparin using different pH solutions.
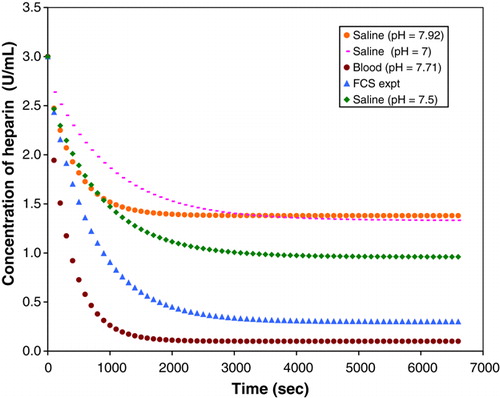
Table 6. Rate Coefficients for the first order adsorption model