Figures & data
Scheme 1 Relationship between xanthine oxidase (XOD), superoxide dismutase (SOD), catalase (CAT), superoxide radical (O2−), and hydrogen peroxide (H2O2).
Table 1. Catalase and SOD activity after cross-linking with hemoglobin in PolyHb, PolySFHb and PolyHb-SOD-CAT
Figure 1. Peroxidase-catalyzed measurement of hydrogen peroxide 3 min after the addition of 200uM of hydrogen peroxide in polySFHb solution (Catalase: 23.0 U/mg Hb).
Figure 2. Catalase activity retained following polymerization.
Figure 3. Hydrogen peroxide measured, 3 min after the addition of 200uM of hydrogen peroxide in polySFHb-CAT solution (1 uM heme) with different catalase concentration.
Figure 4. Conversion NBT to NBT-diformazan, by xanthine/xanthine oxidase–generated superoxides radical(O2−), in the presence of PolyHb or PolySFHb or PolySFHb-SOD-CAT (1 µM heme).
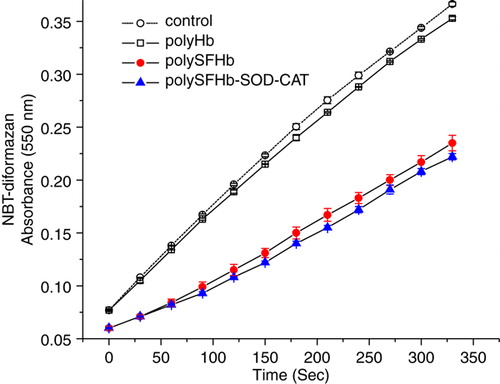
Figure 5. Absorbance spectra of hemoglobin (10µM) in PolyHb following H2O2 addition of 10, 100, 500, and 1000 µM.
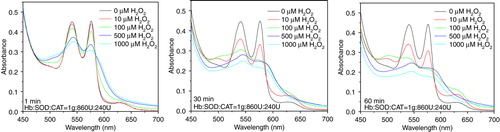
Figure 6. Absorbance spectra of hemoglobin (10µM) in PolySFHb following H2O2 addition of 10, 100, 500, and 1000 µM.
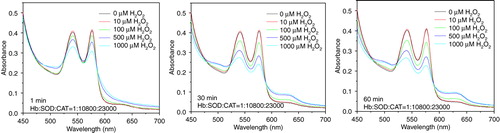
Figure 7. Absorbance spectra of hemoglobin (10µM) in PolyHb-SOD-CAT following H2O2 addition of 10, 100, 500, and 1000 µM.
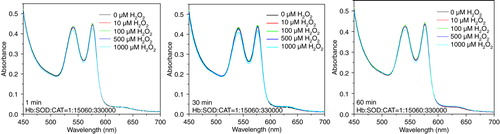
Figure 8. Absorbance spectra of reaction mixtures containing 10 uM of hemoglobin and 2.0 mM of glucose, and 0.2 U/ml glucose oxidase for continuous generation of hydrogen peroxide. Top: PolyHb. Lower left: PolySFHb, Lower right: PolySFHb-SOD-CAT.
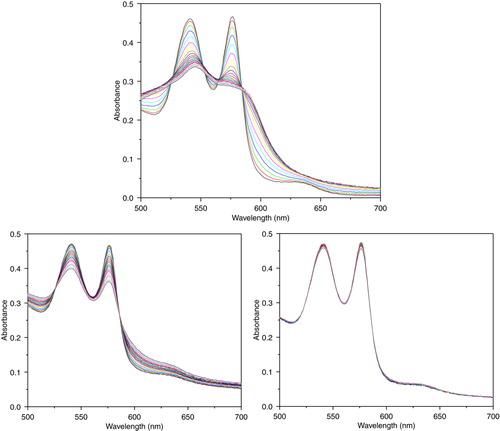
Figure 9. Absorbance spectra of reaction mixtures containing 10 uM of hemoglobin and 100 uM of xanthine, and 10 mU/ml xanthine oxidase for continuous generation of superoxide. Top: PolyHb. Lower left: PolySFHb. Lower right: PolySFHb-SOD-CAT.
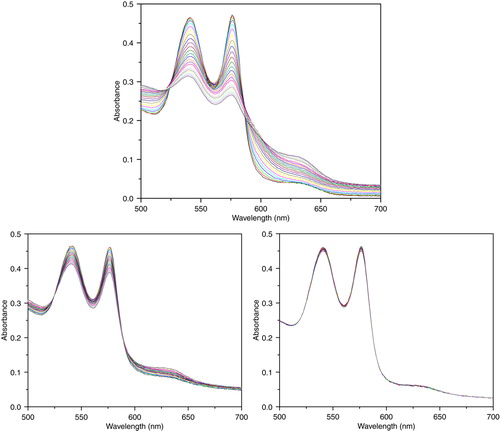
Figure 10. Ferrylhemoglobin formation in the mixture containing 10 µM (heme) of PolyHb, PolySFHb, and PolySFHb-SOD-CAT in the presence of hydrogen peroxide (Left: 100 µM and right: 500 µM).
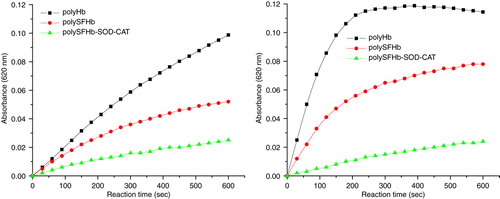
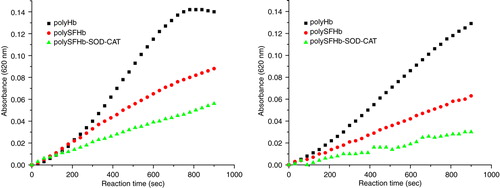
Figure 11. Ferrylhemoglobin formation in the mixture containing 10 µM (heme) of PolyHb, PolySFHb or PolySFHb-SOD-CAT in the presence of (left) glucose (2 mM) /glucose oxidase (0.2 U) and (right) Xanthine (100 µM) /xanthine oxidase (10 mU).