Figures & data
Figure 1. Schematic representation of a Tangential Flow Filtration filter. The direction of the flow through the filter is parallel (or tangential) to the membrane, which reduces the clogging of the filter and improves its efficiency. The pressure difference between the retentate out and feed in ports provides driving pressure for passage through the filter.
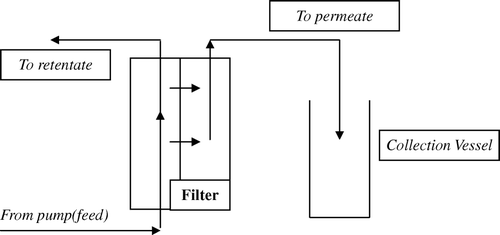
Figure 2. Schema of experimental setup. A: Outflow from reservoir. B: Feed In port of filter. C: Permeate Out port of filter. D: Retentate Out port of filter. E: Retentate In port of reservoir. F: Diafiltration medium In port of reservoir. Upper left: additional elements for diafiltration setup (vessel with distilled water, tubing attached to airtight opening in reservoir).
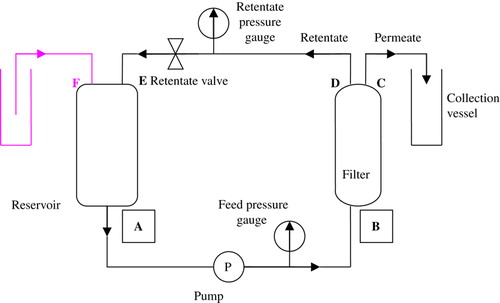
Figure 3. Removal of tetrameric Hb from polyHb with 100kDa filter. Chromatographic results. Left column: Initial Hb mass distribution. Right column: mass distribution post-diafiltration. The best result is obtained with a filter integrity of 0.075 using a flow rate of 0.020ml/min.
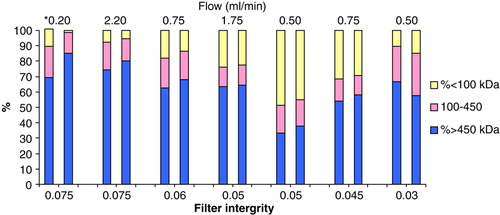
Figure 4. Relationship between filter integrity and percent change in tetrameric Hb in the solution (change calculated as [(Final-Initial)/Initial]%Hb < 100).
![Figure 4. Relationship between filter integrity and percent change in tetrameric Hb in the solution (change calculated as [(Final-Initial)/Initial]%Hb < 100).](/cms/asset/27deb292-68e9-4dd7-becf-48ec66fefb98/ianb19_a_374415_f0004_b.jpg)
Table 1. Removal of tetrameric Hb from polyHb (100kDa filter)
Table 2. Diafiltration SFHb with 500kDa filter
Table 3. Diafiltration SFHb 100kDa filter
Table 4. Diafiltration with 100kDa filter, catalase assay
Table 5. To concentrate PolyHb solution