Figures & data
Figure 1. Protein mass peak 4181 expressed significantly high in the serum of healthy individuals, while serum of OSCC patients presented a remarkably low protein mass peak at 4181 (P=0.0000000060).
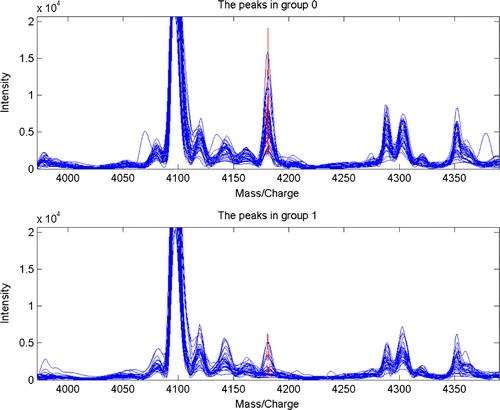
Table 1. Cross-validation results of serum model of OSCC patients and healthy individuals (cases)
Table 2. Seven selected discrepant serum protein mass peaks (m/z) comparison of OSCC patients with healthy individuals (x±SD)
Table 3. Five batches of sera and their proteomic diagnosis models of OSCC
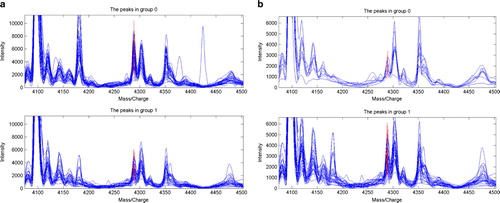
Figure 2. Serum protein mass/charge wave peak 4289 was expressed highly in the normal volunteers group and low in the group of patients with OSCC tumor in batch 5, while it expressed highly in the group of patients with OSCC tumor and low in the group of metastasis patients with OSCC tumor in batch 1. (a) Serum batch 5, tumor 1 vs normal 0, m/z 4289. (b) Serum batch 1, tumor 1 vs metastasis 0, m/z 4289.