Figures & data
Figure 1. Electrophoresis result of Prothrombin gene G20210 DNA amplification fragment in TJR patients. M: DNA Marker 1–10 patients number.
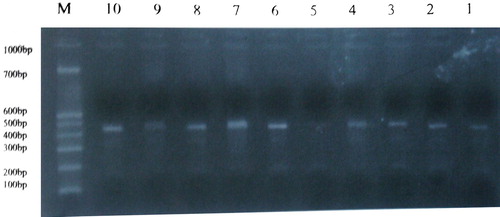
Figure 2. Sequencing result of patient 39 who suffered DVT postoperatively. There was not a G-to-A mutation in the 20210th position (276th in the figure), but a G-to-T mutation in the 20208th position (274th in the figure) was found. AT of the patient was 117% preoperatively, and 89.8% postoperatively.
Table 1. Sequencing results of prothrombin gene G20210A of all patients
Table 2. Statistic comparison of DVT group and non-DVT group after TJR
Table 3. Genotype comparison of DVT group and non-DVT group after TJR
Table 4. Allelic comparison of DVT group and non-DVT group after TJR