Figures & data
Figure 1. The set-up used for measuring oxygen absorption. The vials on the left contain one of the PFC emulsions and the vials on the right contain the blank formulation.
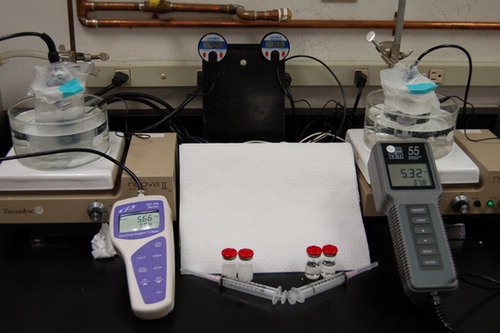
Figure 2. The set-up used to measure the volume expansion upon injection at 37°C.
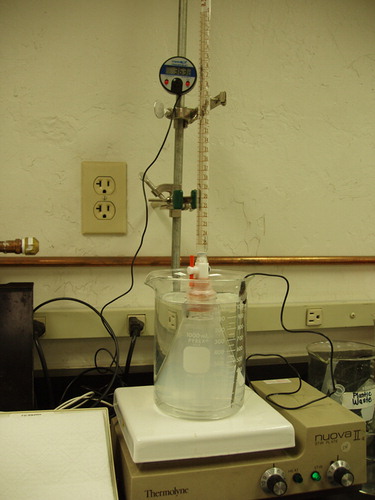
Figure 3. The particle-size distribution of DDFPe for 6 months at 23°C ±2°C. The error bars represent one standard deviation of the triplicate measurements. The open diamonds represent measurements of less than 2% of the particle distribution at that timepoint.
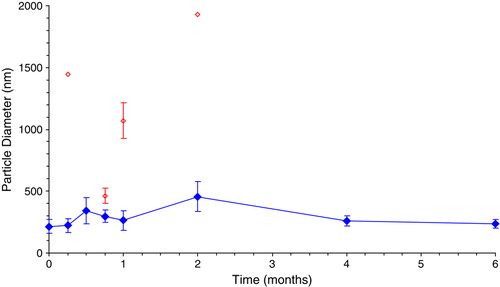
Figure 4. The amount of oxygen absorbed by 5 mL injections of DDFPe (triangles), PFDe (diamonds), PFOBe (squares), and the formulation blank (open circles) at 21C (blue) and 37C (red) over the course of 60 minutes.
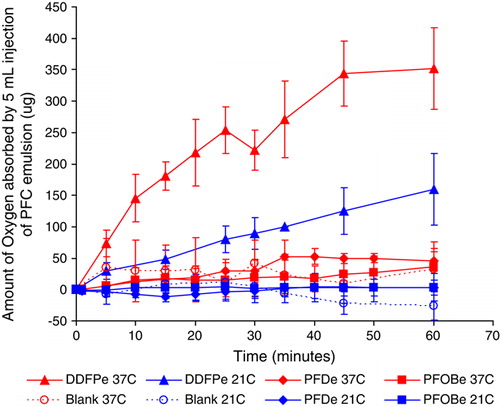
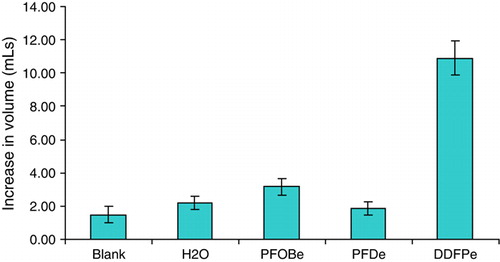
Figure 5. Volume increase upon heating 5 mL injections of the 3 PFC emulsions, the blank formulation, and water to 37°C.