Figures & data
Figure 1. Laser-capture microdissection of OSCC; tumor cryosections were fixed, stained with hematoxylin and eosin (H&E), dehydrated and analyzed under the microscope. Once tumor cells of interest were identified, microdissection was performed, and the cell purity confirmed by inspecting the area of tissue that underwent procurement and the captured cells.
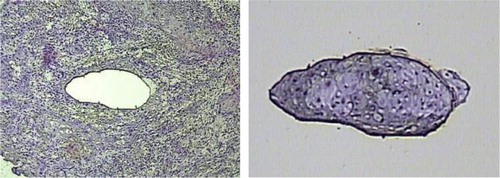
Figure 2. Protein mass peak 3714 expressed significantly high in the OSCC tissue, while the healthy tissue showed a remarkably low protein mass peak at 3714 (P=0.0000922061).
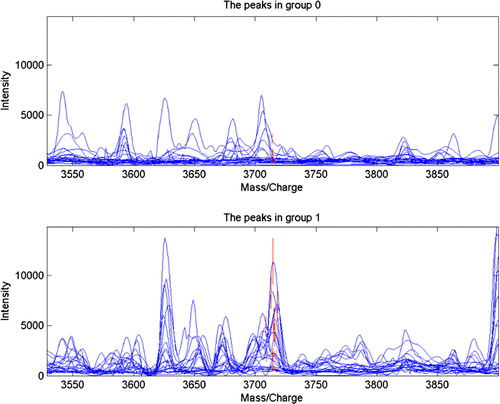
Table 1. The cross-validation results of diagnosis model of OSCC and healthy tissues (cases)
Table 2. The three discrepant tissue protein mass peaks (m/z) in comparison of OSCC with healthy tissues (x±SD)
Table 3. The statistics of two candidate biomarkers for screening OLK from normal tissue
Table 4. The statistics of two candidate biomarkers for screening OLK from OSCC.
Table 5. Three patterns of proteomic diagnosis model of OSCC