Figures & data
Figure 1. Transmission electron microscopy of collagen and HA-collagen fibrils reacted with Au-WGA, which could be bound specifically onto HA. (a) collagen; (b) HA-Collagen. (X100K) (arrows: nano particles bound to HA at a distance from collagen fibrils).
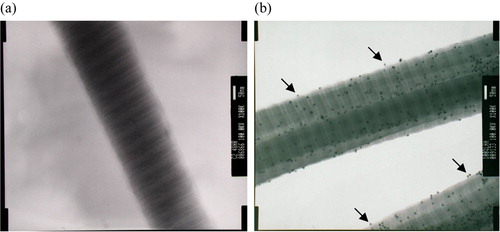
Figure 2. Effect of feed HA/collagen ratio on the extents of surface immobilization by HA. The extent of HA immobilized on the collagen II fibrillar surface was estimated indirectly by the number of Au-WGA nanoparticles bound to fibrils. The number of bound Au-WGA, calculated from 100 TEM photo frames, increase with increasing amounts of reactant HA in the feed.
Figure 3. Topography of the collagen fibrils scanned with atomic force microscope. The scanning was conducted with tapping mode. (a) collagen, scan size = 2.5 µm; (b) HA-collagen, scan size = 1 µm.
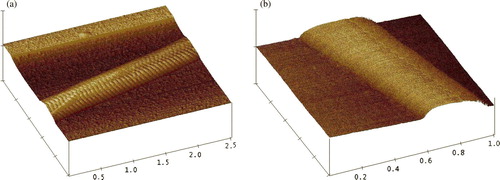
Figure 4. Degradation profiles of fibrils by collagenase digestion. The digestion was conducted with 0.03 mg/mL collagenase at 37oC. The supernatant of the digestion mixture was centrifuged (17,600g) and the protein in the supernatant was taken as the degraded collagen.
Figure 5. Proliferation of KP-hMSCs within the pellet formed by the cells and fibrils of HA-collagen (or untreated collagen). The control group represents cells-pellet without fibrils.