
Figures & data
Figure 1. Flow-chart of patients included in study
Table 1. Baseline characteristics
Figure 2. Number of answers on each research area. Each patient was asked to prioritize two areas. Thirty-one patients chose more than two areas, five patients only chose one area. All priorities are presented in the figure
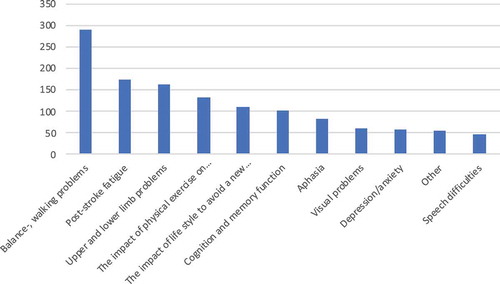
Table 2. Differences in priorities between younger (<70 years) and elderly (≥70 years) patients with stroke