
Figures & data
Table 1. Patient characteristics (n = 359).
Figure 1. Distribution of the USER-Participation Restrictions scale across mRS scores (dark blue) and across different levels of patient-reported decrease in health (light blue) and in daily activities (white) 3 months after stroke.
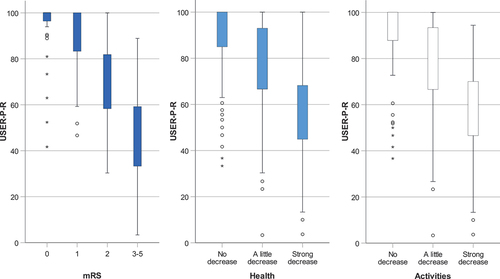
Figure 2. Percentage of participants experiencing restrictions regarding the items of the USER-Participation Restrictions scale across the different mRS levels.
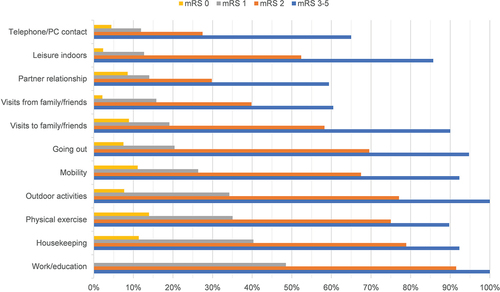
Table 2. Frequencies and descriptive statistics of the USER-participation restrictions scale.
Table 3. Spearman correlations (rho) between the USER-Participation Restrictions scale, the modified Rankin Scale, EQ-5D-5 L (including daily activities item score) and PROMIS-10 (including social participation item score).
Table 4. Ability of the USER-Participation Restrictions scale to discriminate between adjacent mRS levels (mRS 0 vs. mRS 1, mRS 1 vs. mRS 2, mRS 2 vs. mRS 3–5) and different levels of patient-reported decrease in health and in activities post-stroke.
Data availability statement
The data that support the findings of this study are available from the corresponding author upon reasonable request ([email protected]).