
Figures & data
Figure 1. Flow diagram of participant selection.
CFS, clinical frailty scale; SU, Stroke Unit
Table 1. Comparison of clinical characteristics between the non-frail and frail groups.
Figure 2. Distribution of pre-onset CFS scores. the prevalence of frailty (CFS score ≥ 5) is 31, 24, and 47% in the overall, first-onset, and recurrent groups, respectively. The distribution peak is at a CFS score of 3.
CFS, clinical frailty scale
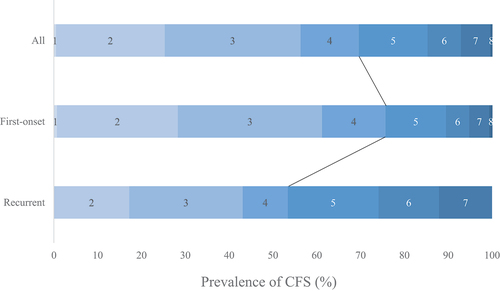
Table 2. Comparison of clinical background characteristics by functional disability at discharge.
Table 3. Logistic regression analysis of predictors of poor discharge outcome (mRS ≥3).