
Figures & data
Table 1. Datasets Used in the Analysis of Quality of Life
Figure 1. Average democracy index and institutionalized democracy score, polity 2, in post-communist states against the rest of the world.
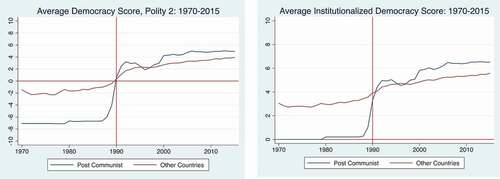
Figure 2. Polity 2 democracy index and institutionalize democracy score by region: 1970–2015 (East Asia (EA), Europe (EU), Latin America & Caribbean (LA), Middle East & North Africa (MENA), North America (NA), South Asia (SA), and sub-Saharan Africa (SSA).
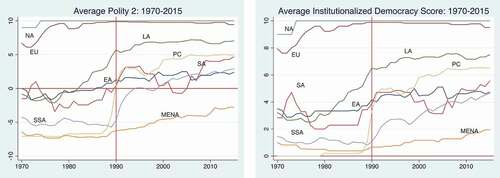
Figure 3. CO2 emission per capita in post-communist and consolidated democracy.
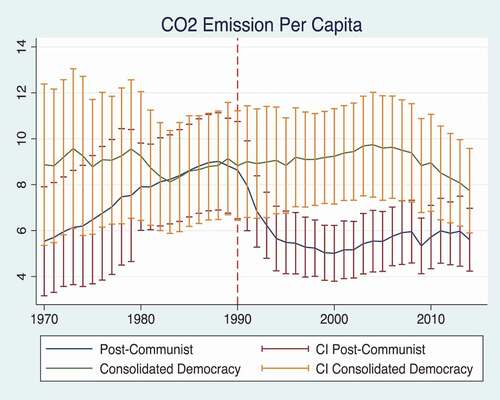
Figure 4. Rankings of CO2 emission per capita among the post-communist states in 2014.
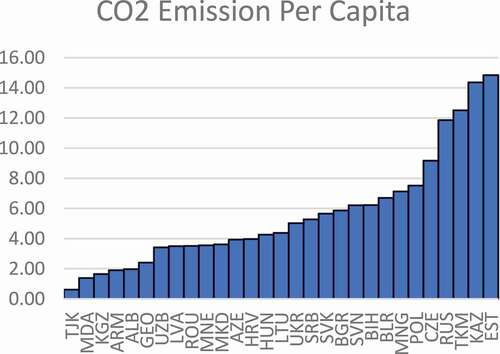
Figure 5. CO2 emission per capita and democracy in post-communist states in 2014.
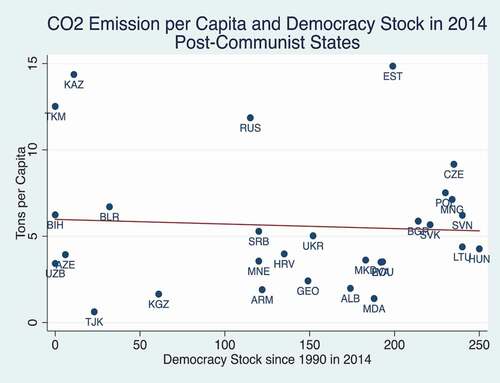
Figure 6. Differences in CO2 emission between post-communist countries and consolidated democracies at transition and along the transition path (difference-in-differences approach).
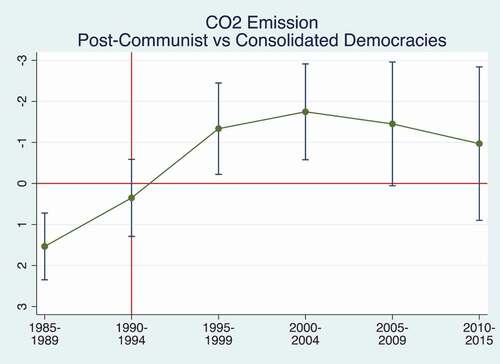
Table 2. Regression Results with Democracy Stock (Dependent Variable: CO2 Emissions Per Capita (Post-Communist States – 1990–2015))
Table 3. Regressions with EU Membership and Democracy Stock (Dependent Variable: CO2 Emissions Per Capita (Post-Communist States – 1990–2015))b