Figures & data
Table 1 Median/mean R-LOS by country for the traumatic SCI population
Figure 1 R-LOS (days) for A) initially identified cohort (n=1455) and B) the cohort with outliers removed (n=1376) as used for analysis.
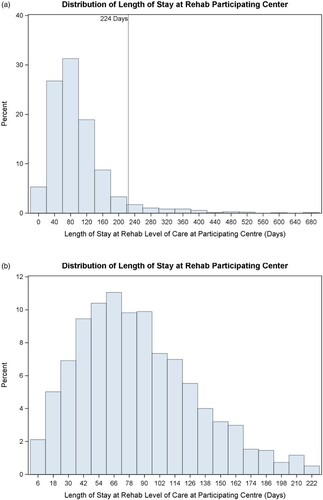
Figure 2 Box plot of R-LOS (days) among adults with traumatic SCI (2004–2014).
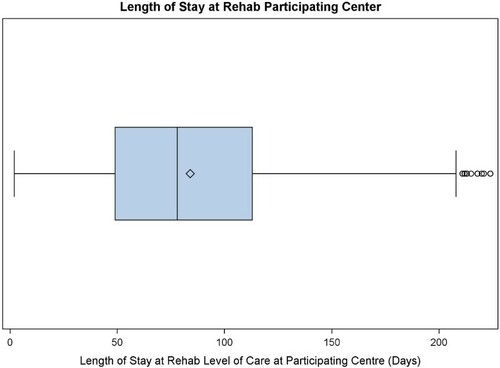
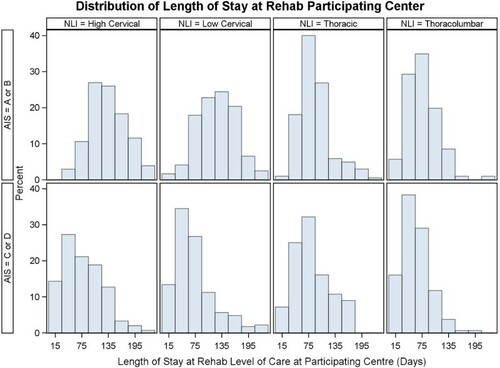
Figure 3 R-LOS (days) distribution based on the individual's neurological Level of injury and ASIA Impairment Scale category.