
Figures & data
Figure 1 FES cycling progress and muscle cross-sectional area changes. DPI, days post injury. CSA, cross-sectional area. Changes from baseline are expressed as a percentage. The result section in the text describes the average power production. For purpose of comparison with other studies, resistance data are also provided in the figure. P1 showed small changes in muscle CSA in the first 6 weeks of low-intensity FES cycling. Overall, P1 gained muscle mass in the stimulated thigh muscles (quadriceps and hamstrings), and lost muscle mass in the non-stimulated calf muscles. At 13.3 weeks, muscle CSA was increased in right and left thighs (16% and 2%, respectively), and decreased in right and left calves (6% and 13%). P2 showed an initial loss in muscle CSA at 2.1 weeks (about 4–5% in left/right calves, and 5–11% in thighs), but regained about 6–7% in calf muscle CSA, and 9–12% in thigh muscle CSA after 6.1 and 8.7 weeks of FES cycling, respectively. P3 showed loss in muscle CSA up to 6 weeks (about 11–13% in calves, and 15% in thighs), and regained some muscle CSA at 8 weeks in calves and left thigh. The sudden apparent increase in left thigh CSA at 4 weeks was due to an increase in thigh circumference with unknown reason. The sudden apparent increase in right thigh CSA at 8 weeks was due to swelling from a diagnosed heterotopic ossification in the right proximal medial thigh. FES cycling was discontinued at 8 weeks, resulting in the decreases in CSA at the 12-week assessment.
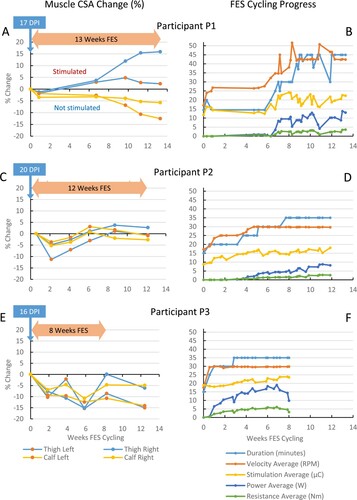
Table 1 Participant information, start and duration of FES cycling.
Table 2 FES stimulation parameters for first and best session.
Table 3 FES cycling performance for first and best session, and progress to OffMotor and voluntary cycling.